Pizza Hut 2008 Annual Report Download - page 130
Download and view the complete annual report
Please find page 130 of the 2008 Pizza Hut annual report below. You can navigate through the pages in the report by either clicking on the pages listed below, or by using the keyword search tool below to find specific information within the annual report.-
 1
1 -
2
-
3
-
4
-
5
-
6
-
7
-
8
-
9
-
10
-
11
-
12
-
13
-
14
-
15
-
16
-
17
-
18
-
19
-
20
-
21
-
22
-
23
-
24
-
25
-
26
-
27
-
28
-
29
-
30
-
31
-
32
-
33
-
34
-
35
-
36
-
37
-
38
-
39
-
40
-
41
-
42
-
43
-
44
-
45
-
46
-
47
-
48
-
49
-
50
-
51
-
52
-
53
-
54
-
55
-
56
-
57
-
58
-
59
-
60
-
61
-
62
-
63
-
64
-
65
-
66
-
67
-
68
-
69
-
70
-
71
-
72
-
73
-
74
-
75
-
76
-
77
-
78
-
79
-
80
-
81
-
82
-
83
-
84
-
85
-
86
-
87
-
88
-
89
-
90
-
91
-
92
-
93
-
94
-
95
-
96
-
97
-
98
-
99
-
100
-
101
-
102
-
103
-
104
-
105
-
106
-
107
-
108
-
109
-
110
-
111
-
112
-
113
-
114
-
115
-
116
-
117
-
118
-
119
-
 120
120 -
 121
121 -
 122
122 -
 123
123 -
 124
124 -
 125
125 -
 126
126 -
 127
127 -
 128
128 -
 129
129 -
 130
130 -
 131
131 -
 132
132 -
 133
133 -
 134
134 -
 135
135 -
 136
136 -
 137
137 -
 138
138 -
 139
139 -
 140
140 -
141
-
142
-
143
-
144
-
145
-
146
-
147
-
148
-
149
-
150
-
151
-
152
-
153
-
154
-
155
-
156
-
157
-
158
-
159
-
160
-
161
-
162
-
163
-
164
-
165
-
166
-
167
-
168
-
169
-
170
-
171
-
172
-
173
-
174
-
175
-
176
-
177
-
178
-
179
-
180
-
181
-
182
-
183
-
184
-
185
-
186
-
187
-
188
-
189
-
190
-
191
-
192
-
193
-
194
-
195
-
196
-
197
-
198
-
199
-
200
-
201
-
202
-
203
-
204
-
205
-
206
-
207
-
208
-
209
-
210
-
211
-
212
-
213
-
214
-
215
-
216
-
217
-
218
-
219
-
220
-
221
-
222
-
223
-
224
-
225
-
226
-
227
-
228
-
229
-
230
-
231
-
232
-
233
-
234
-
235
-
236
-
237
-
238
-
239
-
240
 |
 |

8
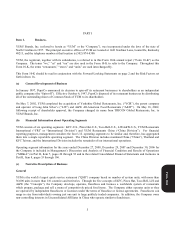
Working Capital
Information about the Company’s working capital is included in MD&A in Part II, Item 7, pages 24 through 52 and the
Consolidated Statements of Cash Flows in Part II, Item 8, page 57.
Customers
The Company’s business is not dependent upon a single customer or small group of customers.
Seasonal Operations
The Company does not consider its operations to be seasonal to any material degree.
Backlog Orders
Company restaurants have no backlog orders.
Government Contracts
No material portion of the Company’s business is subject to renegotiation of profits or termination of contracts or
subcontracts at the election of the U.S. government.
Competition
The retail food industry, in which the Company competes, is made up of supermarkets, supercenters, warehouse stores,
convenience stores, coffee shops, snack bars, delicatessens and restaurants (including the QSR segment), and is intensely
competitive with respect to food quality, price, service, convenience, location and concept. The industry is often affected
by changes in consumer tastes; national, regional or local economic conditions; currency fluctuations; demographic
trends; traffic patterns; the type, number and location of competing food retailers and products; and disposable purchasing
power. Each of the Concepts compete with international, national and regional restaurant chains as well as locally-owned
restaurants, not only for customers, but also for management and hourly personnel, suitable real estate sites and qualified
franchisees. In 2008, the restaurant business in the U.S. consisted of about 945,000 restaurants representing
approximately $552 billion in annual sales. The Company’s Concepts accounted for about 2% of those restaurants and
about 3% of those sales. There is currently no way to reasonably estimate the size of the competitive market outside the
U.S.
Research and Development (“R&D”)
The Company’s subsidiaries operate R&D facilities in Louisville, Kentucky (KFC); Dallas, Texas (Pizza Hut and YRI);
and Irvine, California (Taco Bell) and in several locations outside the U.S., including Shanghai, China (China). The
Company expensed $34 million, $39 million and $33 million in 2008, 2007 and 2006, respectively, for R&D activities.
From time to time, independent suppliers also conduct research and development activities for the benefit of the YUM
system.
Form 10-K