Pizza Hut 2008 Annual Report Download - page 220
Download and view the complete annual report
Please find page 220 of the 2008 Pizza Hut annual report below. You can navigate through the pages in the report by either clicking on the pages listed below, or by using the keyword search tool below to find specific information within the annual report.-
 1
1 -
2
-
3
-
4
-
5
-
6
-
7
-
8
-
9
-
10
-
11
-
12
-
13
-
14
-
15
-
16
-
17
-
18
-
19
-
20
-
21
-
22
-
23
-
24
-
25
-
26
-
27
-
28
-
29
-
30
-
31
-
32
-
33
-
34
-
35
-
36
-
37
-
38
-
39
-
40
-
41
-
42
-
43
-
44
-
45
-
46
-
47
-
48
-
49
-
50
-
51
-
52
-
53
-
54
-
55
-
56
-
57
-
58
-
59
-
60
-
61
-
62
-
63
-
64
-
65
-
66
-
67
-
68
-
69
-
70
-
71
-
72
-
73
-
74
-
75
-
76
-
77
-
78
-
79
-
80
-
81
-
82
-
83
-
84
-
85
-
86
-
87
-
88
-
89
-
90
-
91
-
92
-
93
-
94
-
95
-
96
-
97
-
98
-
99
-
100
-
101
-
102
-
103
-
104
-
105
-
106
-
107
-
108
-
109
-
110
-
111
-
112
-
113
-
114
-
115
-
116
-
117
-
118
-
119
-
120
-
121
-
122
-
123
-
124
-
125
-
126
-
127
-
128
-
129
-
130
-
131
-
132
-
133
-
134
-
135
-
136
-
137
-
138
-
139
-
140
-
141
-
142
-
143
-
144
-
145
-
146
-
147
-
148
-
149
-
150
-
151
-
152
-
153
-
154
-
155
-
156
-
157
-
158
-
159
-
160
-
161
-
162
-
163
-
164
-
165
-
166
-
167
-
168
-
169
-
170
-
171
-
172
-
173
-
174
-
175
-
176
-
177
-
178
-
179
-
180
-
181
-
182
-
183
-
184
-
185
-
186
-
187
-
188
-
189
-
190
-
191
-
192
-
193
-
194
-
195
-
196
-
197
-
198
-
199
-
200
-
201
-
202
-
203
-
204
-
205
-
206
-
207
-
208
-
209
-
 210
210 -
 211
211 -
 212
212 -
 213
213 -
 214
214 -
 215
215 -
 216
216 -
 217
217 -
 218
218 -
 219
219 -
 220
220 -
 221
221 -
 222
222 -
 223
223 -
 224
224 -
 225
225 -
 226
226 -
 227
227 -
 228
228 -
 229
229 -
 230
230 -
231
-
232
-
233
-
234
-
235
-
236
-
237
-
238
-
239
-
240
 |
 |

98
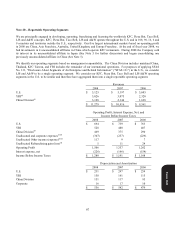
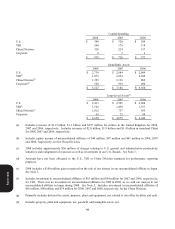
Capital Spending
2008 2007 2006
U.S. $ 349 $ 320 $ 299
YRI 260 179 114
China Division 320 224 157
Corporate 6 3 2
$ 935 $ 726 $ 572
Identifiable Assets
2008 2007 2006
U.S. $ 2
,
739 $ 2
,
884 $ 2
,
909
YRI(f) 1,873 2,254 2,100
China Division(f) 1,395 1,116 869
Cor
p
orate(g) 520 934 490
$6
,
527 $ 7
,
188 $ 6
,
368
Lon
g
-Lived Assets(h)
2008 2007 2006
U.S. $ 2
,
413 $ 2
,
595 $ 2
,
604
YRI(i) 1,162 1,450 1,357
China Division(i) 1,012 757 595
Cor
p
orate 63 73 84
$4
,
650 $ 4
,
875 $ 4
,
640
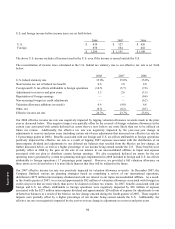
(a) Includes revenues of $1.2 billion, $1.3 billion and $673 million for entities in the United Kingdom for 2008,
2007 and 2006, respectively. Includes revenues of $2.8 billion, $1.9 billion and $1.4 billion in mainland China
for 2008, 2007 and 2006, respectively.
(b) Includes equity income of unconsolidated affiliates of $40 million, $47 million and $41 million in 2008, 2007
and 2006, respectively, for the China Division.
(c) 2008 includes approximately $56 million of charges relating to U.S. general and administrative productivity
initiatives and realignment of resources as well as investments in our U.S. Brands. See Note 5.
(d) Amounts have not been allocated to the U.S., YRI or China Division segments for performance reporting
purposes.
(e) 2008 includes a $100 million gain recognized on the sale of our interest in our unconsolidated affiliate in Japan.
See Note 5.
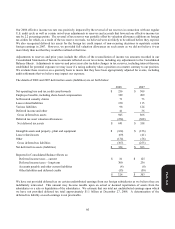
(f) Includes investment in unconsolidated affiliates of $63 million and $64 million for 2007 and 2006, respectively,
for YRI. There was no investment in unconsolidated affiliates for YRI in 2008, as we sold our interest in our
unconsolidated affiliate in Japan during 2008. See Note 5. Includes investment in unconsolidated affiliates of
$65 million, $90 million and $74 million for 2008, 2007 and 2006, respectively, for the China Division.
(g) Primarily includes deferred tax assets, property, plant and equipment, net, related to our office facilities and cash.
(h) Includes property, plant and equipment, net, goodwill, and intangible assets, net.
Form 10-K