Neiman Marcus 2004 Annual Report Download - page 97
Download and view the complete annual report
Please find page 97 of the 2004 Neiman Marcus annual report below. You can navigate through the pages in the report by either clicking on the pages listed below, or by using the keyword search tool below to find specific information within the annual report.-
 1
1 -
2
-
3
-
4
-
5
-
6
-
7
-
8
-
9
-
10
-
11
-
12
-
13
-
14
-
15
-
16
-
17
-
18
-
19
-
20
-
21
-
22
-
23
-
24
-
25
-
26
-
27
-
28
-
29
-
30
-
31
-
32
-
33
-
34
-
35
-
36
-
37
-
38
-
39
-
40
-
41
-
42
-
43
-
44
-
45
-
46
-
47
-
48
-
49
-
50
-
51
-
52
-
53
-
54
-
55
-
56
-
57
-
58
-
59
-
60
-
61
-
62
-
63
-
64
-
65
-
66
-
67
-
68
-
69
-
70
-
71
-
72
-
73
-
74
-
75
-
76
-
77
-
78
-
79
-
80
-
81
-
82
-
83
-
84
-
85
-
86
-
 87
87 -
 88
88 -
 89
89 -
 90
90 -
 91
91 -
 92
92 -
 93
93 -
 94
94 -
 95
95 -
 96
96 -
 97
97 -
 98
98 -
 99
99 -
 100
100 -
 101
101 -
 102
102 -
 103
103 -
 104
104 -
 105
105 -
 106
106 -
 107
107 -
108
-
109
-
110
-
111
-
112
-
113
-
114
-
115
-
116
-
117
-
118
-
119
-
120
-
121
-
122
-
123
-
124
-
125
-
126
-
127
-
128
-
129
-
130
-
131
-
132
-
133
-
134
-
135
-
136
-
137
-
138
-
139
-
140
-
141
-
142
-
143
-
144
-
145
-
146
-
147
-
148
-
149
-
150
-
151
-
152
-
153
-
154
-
155
-
156
-
157
-
158
-
159
-
160
-
161
-
162
-
163
-
164
-
165
-
166
-
167
-
168
-
169
-
170
-
171
-
172
-
173
-
174
-
175
-
176
-
177
-
178
 |
 |

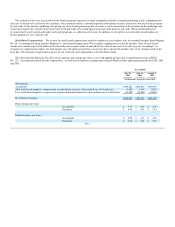
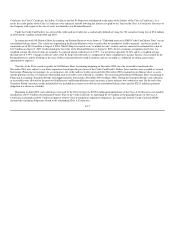
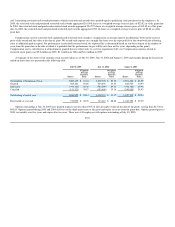
The table below summarizes the amount of cash flows between us and the Trust (prior to the Credit Card Sale in 2005):
Years Ended
July 30,
2005
July 31,
2004
August 2,
2003
(in millions)
Principal collections:
Reinvested by the Trust in revolving period securitizations $2,013.4 $1,958.9 $1,719.9
Reinvested portion allocable to Retained Interests — 483.4 922.4
Servicing fees received by the Company 5.4 6.3 6.3
Excess cash flows related to the IO Strip $ 52.4 $ 53.6 $ 46.7
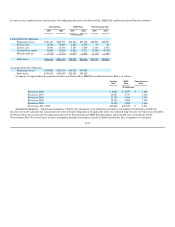
The table below provides historical credit card delinquencies and net credit losses:
Years Ended
July 31,
2004
August 2,
2003
(in millions, except percentages)
Total face value of receivables $ 527.7 $ 471.0
Delinquent principal over 90 days 1.8% 1.8%
Annual credit losses (net of recoveries) $ 14.3 $ 14.3
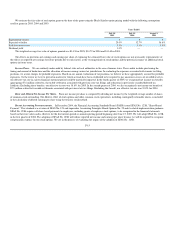
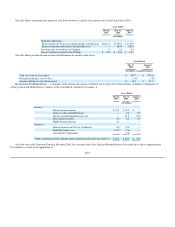
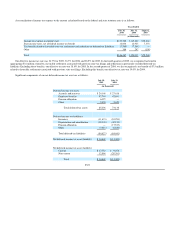
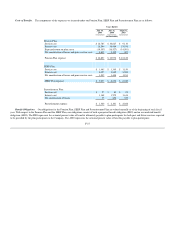
Income from Credit Operations. A summary of the income and expenses related to our accounts receivable portfolio, included as components of
selling, general and administrative expenses in the consolidated statements of earnings, is:
Years Ended
July 30,
2005
July 31,
2004
August 2,
2003
(in millions)
Income:
Finance charge income $ 78.7 $ 39.9 $ —
Gains on sales of Sold Interests — 3.2 8.0
Income from Retained Interests, net — 21.5 39.0
Servicing fee income 5.4 6.3 6.3
HSBC Program Income 2.2 — —
Expenses:
Interest expense on Class A Certificates (5.2) (2.1) —
Bad debt expense, net (14.7) (7.6) —
Amortization of premium — (7.6) —
Credit contribution before administration, promotion and marketing expenses $ 66.4 $ 53.6 $ 53.3
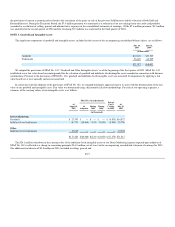
As of the start of the Transition Period in December 2003, the carrying value of the Sold and Retained Interests exceeded face value by approximately
$7.6 million as a result of the application of
F-18