Neiman Marcus 2004 Annual Report Download - page 103
Download and view the complete annual report
Please find page 103 of the 2004 Neiman Marcus annual report below. You can navigate through the pages in the report by either clicking on the pages listed below, or by using the keyword search tool below to find specific information within the annual report.-
 1
1 -
2
-
3
-
4
-
5
-
6
-
7
-
8
-
9
-
10
-
11
-
12
-
13
-
14
-
15
-
16
-
17
-
18
-
19
-
20
-
21
-
22
-
23
-
24
-
25
-
26
-
27
-
28
-
29
-
30
-
31
-
32
-
33
-
34
-
35
-
36
-
37
-
38
-
39
-
40
-
41
-
42
-
43
-
44
-
45
-
46
-
47
-
48
-
49
-
50
-
51
-
52
-
53
-
54
-
55
-
56
-
57
-
58
-
59
-
60
-
61
-
62
-
63
-
64
-
65
-
66
-
67
-
68
-
69
-
70
-
71
-
72
-
73
-
74
-
75
-
76
-
77
-
78
-
79
-
80
-
81
-
82
-
83
-
84
-
85
-
86
-
87
-
88
-
89
-
90
-
91
-
92
-
 93
93 -
 94
94 -
 95
95 -
 96
96 -
 97
97 -
 98
98 -
 99
99 -
 100
100 -
 101
101 -
 102
102 -
 103
103 -
 104
104 -
 105
105 -
 106
106 -
 107
107 -
 108
108 -
 109
109 -
 110
110 -
 111
111 -
 112
112 -
 113
113 -
114
-
115
-
116
-
117
-
118
-
119
-
120
-
121
-
122
-
123
-
124
-
125
-
126
-
127
-
128
-
129
-
130
-
131
-
132
-
133
-
134
-
135
-
136
-
137
-
138
-
139
-
140
-
141
-
142
-
143
-
144
-
145
-
146
-
147
-
148
-
149
-
150
-
151
-
152
-
153
-
154
-
155
-
156
-
157
-
158
-
159
-
160
-
161
-
162
-
163
-
164
-
165
-
166
-
167
-
168
-
169
-
170
-
171
-
172
-
173
-
174
-
175
-
176
-
177
-
178
 |
 |
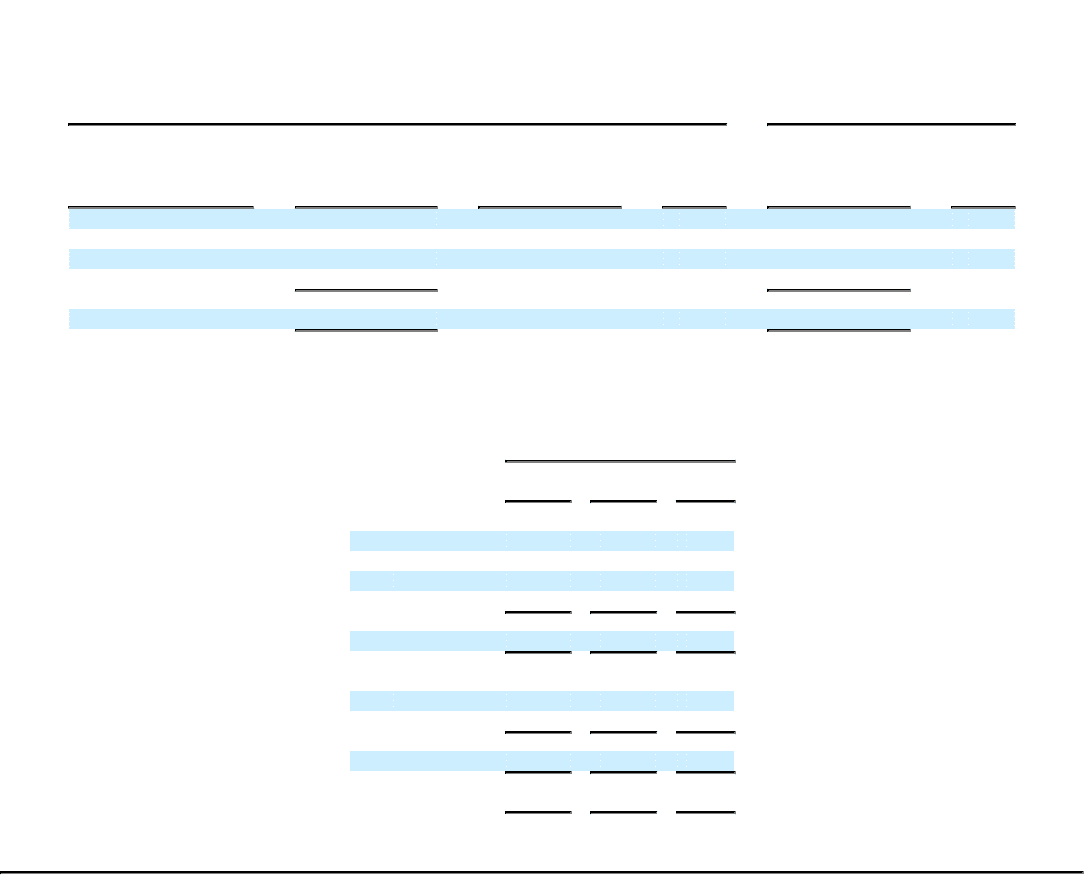
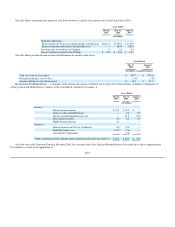
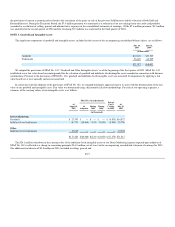
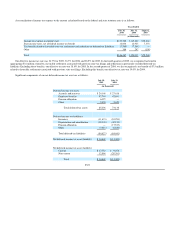
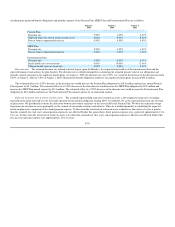
The following table summarizes information about our stock options as of July 30, 2005:
Options Outstanding Options Exercisable
Range
Of
Exercise
Prices
Shares
Outstanding
At July 30,
2005
Weighted-
Average
Remaining
Contractual
Life (Years)
Weighted-
Average
Exercise
Price
Shares
Outstanding
At July 30,
2005
Weighted-
Average
Exercise
Price
$15.38-$29.19 605,390 4.9 $ 24.67 434,590 $ 24.70
$30.35-$36.50 1,113,825 3.8 $ 32.56 283,300 35.00
$43.05-$53.08 784,850 4.2 $ 43.31 — —
$55.95-$60.83 546,790 5.2 $ 56.89 — —
3,050,855 4.4 $ 38.12 717,890 $ 28.76
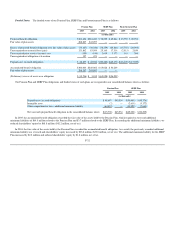
NOTE 7. Income Taxes
The significant components of income tax expense are as follows:
Years Ended
July 30,
2005
July 31,
2004
August 2,
2003
(in thousands)
Current:
Federal $148,079 $ 93,963 $64,758
State 13,206 3,328 6,854
Foreign 307 367 192
161,592 97,658 71,804
Deferred:
Federal (13,303) 21,177 6,944
State (1,802) 2,097 500
(15,105) 23,274 7,444
Income tax expense $146,487 $120,932 $79,248
F-24