Neiman Marcus 2004 Annual Report Download - page 117
Download and view the complete annual report
Please find page 117 of the 2004 Neiman Marcus annual report below. You can navigate through the pages in the report by either clicking on the pages listed below, or by using the keyword search tool below to find specific information within the annual report.-
 1
1 -
2
-
3
-
4
-
5
-
6
-
7
-
8
-
9
-
10
-
11
-
12
-
13
-
14
-
15
-
16
-
17
-
18
-
19
-
20
-
21
-
22
-
23
-
24
-
25
-
26
-
27
-
28
-
29
-
30
-
31
-
32
-
33
-
34
-
35
-
36
-
37
-
38
-
39
-
40
-
41
-
42
-
43
-
44
-
45
-
46
-
47
-
48
-
49
-
50
-
51
-
52
-
53
-
54
-
55
-
56
-
57
-
58
-
59
-
60
-
61
-
62
-
63
-
64
-
65
-
66
-
67
-
68
-
69
-
70
-
71
-
72
-
73
-
74
-
75
-
76
-
77
-
78
-
79
-
80
-
81
-
82
-
83
-
84
-
85
-
86
-
87
-
88
-
89
-
90
-
91
-
92
-
93
-
94
-
95
-
96
-
97
-
98
-
99
-
100
-
101
-
102
-
103
-
104
-
105
-
106
-
 107
107 -
 108
108 -
 109
109 -
 110
110 -
 111
111 -
 112
112 -
 113
113 -
 114
114 -
 115
115 -
 116
116 -
 117
117 -
 118
118 -
 119
119 -
 120
120 -
 121
121 -
 122
122 -
 123
123 -
 124
124 -
 125
125 -
 126
126 -
 127
127 -
128
-
129
-
130
-
131
-
132
-
133
-
134
-
135
-
136
-
137
-
138
-
139
-
140
-
141
-
142
-
143
-
144
-
145
-
146
-
147
-
148
-
149
-
150
-
151
-
152
-
153
-
154
-
155
-
156
-
157
-
158
-
159
-
160
-
161
-
162
-
163
-
164
-
165
-
166
-
167
-
168
-
169
-
170
-
171
-
172
-
173
-
174
-
175
-
176
-
177
-
178
 |
 |
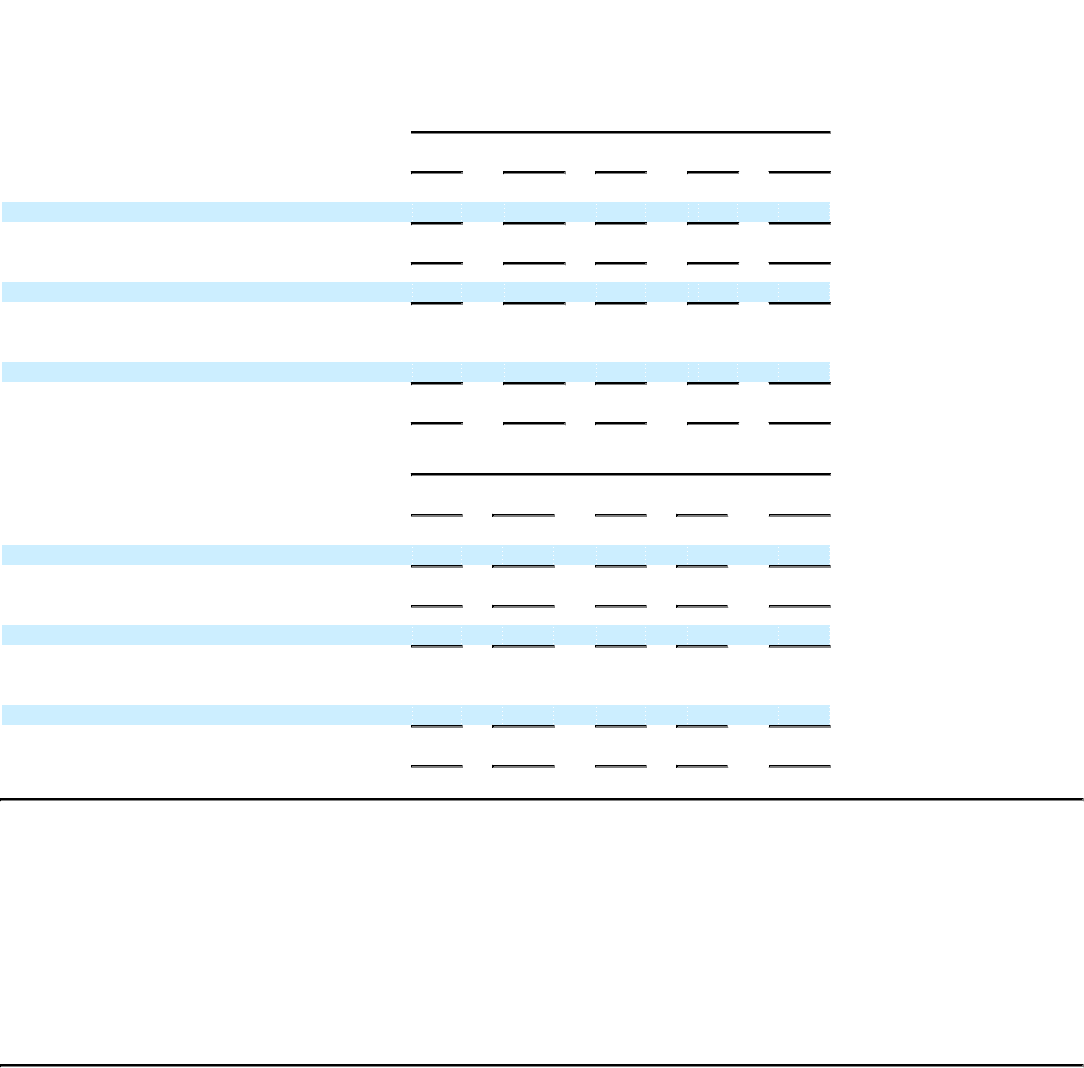
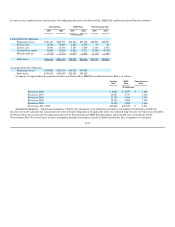
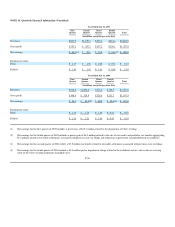
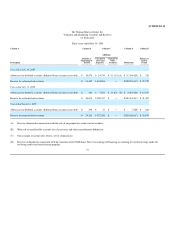
NOTE 14. Quarterly Financial Information (Unaudited)
Year Ended July 30, 2005
First
Quarter
Second
Quarter
Third
Quarter
Fourth
Quarter Total
(in millions, except for per share data)
Revenues $907.9 $1,129.2 $933.4 $851.4 $3,821.9
Gross profit $353.2 $ 367.2 $357.2 $250.1 $1,327.8
Net earnings $ 64.1(1) $ 70.6 $ 79.8 $ 34.3(2) $ 248.8
Earnings per share:
Basic $ 1.33 $ 1.46 $ 1.65 $ 0.71 $ 5.15
Diluted $ 1.30 $ 1.43 $ 1.61 $ 0.68 $ 5.02
Year Ended July 31, 2004
First
Quarter
Second
Quarter
Third
Quarter
Fourth
Quarter Total
(in millions, except for per share data)
Revenues $818.8 $1,048.4 $873.2 $784.5 $3,524.8
Gross profit $308.4 $ 329.4 $328.5 $231.2 $1,197.5
Net earnings $ 56.2 $ 59.2(3) $ 68.8 $ 20.6(4) $ 204.8
Earnings per share:
Basic $ 1.18 $ 1.23 $ 1.43 $ 0.43 $ 4.27
Diluted $ 1.16 $ 1.21 $ 1.40 $ 0.42 $ 4.19
Net earnings for the first quarter of 2005 includes a pretax loss of $15.3 million related to the disposition of Chef's Catalog.
Net earnings for the fourth quarter of 2005 includes a pretax gain of $6.2 million related to the sale of our credit card portfolio, tax benefits aggregating
$7.6 million related to favorable settlements associated with previous state tax filings and reductions in previously recorded deferred tax liabilities.
Net earnings for the second quarter of 2004 reflect a $7.5 million tax benefit related to favorable settlements associated with previous state tax filings.
Net earnings for the fourth quarter of 2004 include a $3.9 million pretax impairment charge related to the writedown to fair value in the net carrying
value of the Chef's Catalog tradename intangible asset.
F-38
(1)
(2)
(3)
(4)