Neiman Marcus 2004 Annual Report Download - page 84
Download and view the complete annual report
Please find page 84 of the 2004 Neiman Marcus annual report below. You can navigate through the pages in the report by either clicking on the pages listed below, or by using the keyword search tool below to find specific information within the annual report.-
 1
1 -
2
-
3
-
4
-
5
-
6
-
7
-
8
-
9
-
10
-
11
-
12
-
13
-
14
-
15
-
16
-
17
-
18
-
19
-
20
-
21
-
22
-
23
-
24
-
25
-
26
-
27
-
28
-
29
-
30
-
31
-
32
-
33
-
34
-
35
-
36
-
37
-
38
-
39
-
40
-
41
-
42
-
43
-
44
-
45
-
46
-
47
-
48
-
49
-
50
-
51
-
52
-
53
-
54
-
55
-
56
-
57
-
58
-
59
-
60
-
61
-
62
-
63
-
64
-
65
-
66
-
67
-
68
-
69
-
70
-
71
-
72
-
73
-
 74
74 -
 75
75 -
 76
76 -
 77
77 -
 78
78 -
 79
79 -
 80
80 -
 81
81 -
 82
82 -
 83
83 -
 84
84 -
 85
85 -
 86
86 -
 87
87 -
 88
88 -
 89
89 -
 90
90 -
 91
91 -
 92
92 -
 93
93 -
 94
94 -
95
-
96
-
97
-
98
-
99
-
100
-
101
-
102
-
103
-
104
-
105
-
106
-
107
-
108
-
109
-
110
-
111
-
112
-
113
-
114
-
115
-
116
-
117
-
118
-
119
-
120
-
121
-
122
-
123
-
124
-
125
-
126
-
127
-
128
-
129
-
130
-
131
-
132
-
133
-
134
-
135
-
136
-
137
-
138
-
139
-
140
-
141
-
142
-
143
-
144
-
145
-
146
-
147
-
148
-
149
-
150
-
151
-
152
-
153
-
154
-
155
-
156
-
157
-
158
-
159
-
160
-
161
-
162
-
163
-
164
-
165
-
166
-
167
-
168
-
169
-
170
-
171
-
172
-
173
-
174
-
175
-
176
-
177
-
178
 |
 |

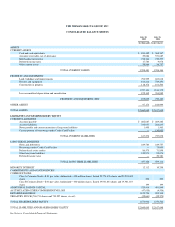
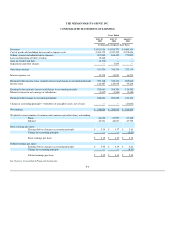
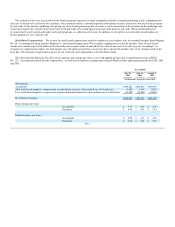
THE NEIMAN MARCUS GROUP, INC.
CONSOLIDATED STATEMENTS OF EARNINGS
Years Ended
July 30,
2005
July 31,
2004
August 2,
2003
(in thousands, except per share data)
Revenues $3,821,924 $3,524,771 $3,080,353
Cost of goods sold including buying and occupancy costs 2,494,172 2,327,229 2,078,436
Selling, general and administrative expenses 907,048 848,453 779,807
Loss on disposition of Chef's Catalog 15,348 — —
Gain on Credit Card Sale (6,170) — —
Impairment and other charges — 3,853 —
Operating earnings 411,526 345,236 222,110
Interest expense, net 12,378 15,923 16,270
Earnings before income taxes, minority interest and change in accounting principle 399,148 329,313 205,840
Income taxes 146,487 120,932 79,248
Earnings before minority interest and change in accounting principle 252,661 208,381 126,592
Minority interest in net earnings of subsidiaries (3,837) (3,549) (2,488)
Earnings before change in accounting principle 248,824 204,832 124,104
Change in accounting principle—writedown of intangible assets, net of taxes — — (14,801)
Net earnings $ 248,824 $ 204,832 $ 109,303
Weighted average number of common and common equivalent shares outstanding:
Basic 48,330 47,997 47,462
Diluted 49,531 48,873 47,795
Basic earnings per share:
Earnings before change in accounting principle $ 5.15 $ 4.27 $ 2.61
Change in accounting principle — — (0.31)
Basic earnings per share $ 5.15 $ 4.27 $ 2.30
Diluted earnings per share:
Earnings before change in accounting principle $ 5.02 $ 4.19 $ 2.60
Change in accounting principle — — (0.31)
Diluted earnings per share $ 5.02 $ 4.19 $ 2.29
See Notes to Consolidated Financial Statements.
F-6