Neiman Marcus 2004 Annual Report Download - page 25
Download and view the complete annual report
Please find page 25 of the 2004 Neiman Marcus annual report below. You can navigate through the pages in the report by either clicking on the pages listed below, or by using the keyword search tool below to find specific information within the annual report.-
 1
1 -
2
-
3
-
4
-
5
-
6
-
7
-
8
-
9
-
10
-
11
-
12
-
13
-
14
-
 15
15 -
 16
16 -
 17
17 -
 18
18 -
 19
19 -
 20
20 -
 21
21 -
 22
22 -
 23
23 -
 24
24 -
 25
25 -
 26
26 -
 27
27 -
 28
28 -
 29
29 -
 30
30 -
 31
31 -
 32
32 -
 33
33 -
 34
34 -
 35
35 -
36
-
37
-
38
-
39
-
40
-
41
-
42
-
43
-
44
-
45
-
46
-
47
-
48
-
49
-
50
-
51
-
52
-
53
-
54
-
55
-
56
-
57
-
58
-
59
-
60
-
61
-
62
-
63
-
64
-
65
-
66
-
67
-
68
-
69
-
70
-
71
-
72
-
73
-
74
-
75
-
76
-
77
-
78
-
79
-
80
-
81
-
82
-
83
-
84
-
85
-
86
-
87
-
88
-
89
-
90
-
91
-
92
-
93
-
94
-
95
-
96
-
97
-
98
-
99
-
100
-
101
-
102
-
103
-
104
-
105
-
106
-
107
-
108
-
109
-
110
-
111
-
112
-
113
-
114
-
115
-
116
-
117
-
118
-
119
-
120
-
121
-
122
-
123
-
124
-
125
-
126
-
127
-
128
-
129
-
130
-
131
-
132
-
133
-
134
-
135
-
136
-
137
-
138
-
139
-
140
-
141
-
142
-
143
-
144
-
145
-
146
-
147
-
148
-
149
-
150
-
151
-
152
-
153
-
154
-
155
-
156
-
157
-
158
-
159
-
160
-
161
-
162
-
163
-
164
-
165
-
166
-
167
-
168
-
169
-
170
-
171
-
172
-
173
-
174
-
175
-
176
-
177
-
178
 |
 |

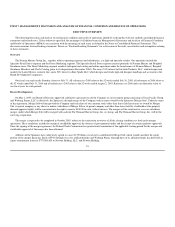
We also receive allowances from certain merchandise vendors in conjunction with compensation programs for employees who sell the vendor's
merchandise. These allowances are netted against the related compensation expense that we incur. Amounts received from vendors related to compensation
programs were $53.2 million in 2005 and $46.3 million in 2004.
Changes in our selling, general and administrative expenses are affected primarily by the following factors:
changes in the number of sales associates primarily due to expansion of existing stores and new store openings, including increased health care
and related benefits expenses;
changes in expenses relating to the production of print catalogs including, paper, printing and postage costs;
changes in expenses related to insurance and long-term benefits due to general economic conditions such as rising health care costs; and
changes in the HSBC Program Income related to changes in aggregate credit card sales or the rates of reimbursement under the Program (as
further described below).
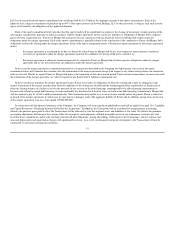
In the future, our selling, general and administrative expenses will be impacted by the Credit Card Sale. In 2005, our credit card operations generated net
finance charge income of approximately $75.4 million. If the Credit Card Sale had been consummated as of the first day of 2005, we believe, the HSBC
Program Income for 2005 would have been at least $42 million. HSBC and the Company are currently in the process of implementing changes to the
proprietary credit card program that we expect will be fully implemented during the fourth quarter of 2006. Had such changes been fully implemented on the
first day of 2005, we believe the HSBC Program Income for 2005 would have been approximately $56 million.
The HSBC Program Income may be:
decreased based upon the level of future services, such as statement preparation and mailing, we provide to HSBC; and
increased based upon contemplated changes to our historical credit card program related to, among other things, the interest rates applied to
unpaid balances and the assessment of late fees.
Fiscal Year 2005 Highlights
We believe that our product assortment of luxury, designer and fashion merchandise, coupled with our sales promotion activities and our commitment to
superior customer service, have been critical to our success in the past. In addition, we believe these factors are critical to our future growth and success.
Major financial accomplishments in 2005 include:
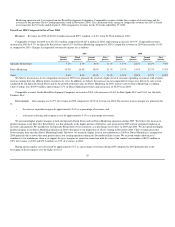
Revenues—Our revenues for 2005 were $3,821.9 million, the highest in our history. Revenues increased 8.4% in 2005 as compared to 2004,
with increases in comparable store sales in all four quarters compared to the same periods in 2004. Comparable revenues percentage increases by
quarter for 2005 as compared to the same periods in 2004 were:
First quarter 11.4%
Second quarter 10.4%
Third quarter 8.0%
Fourth quarter 9.6%
For Specialty Retail Stores, our sales per square foot increased by 9.3% to $577 in 2005 compared to $528 in 2004.
22
•
•
•
•
•
•
•