Neiman Marcus 2004 Annual Report Download - page 68
Download and view the complete annual report
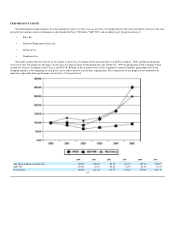
Please find page 68 of the 2004 Neiman Marcus annual report below. You can navigate through the pages in the report by either clicking on the pages listed below, or by using the keyword search tool below to find specific information within the annual report.-
 1
1 -
2
-
3
-
4
-
5
-
6
-
7
-
8
-
9
-
10
-
11
-
12
-
13
-
14
-
15
-
16
-
17
-
18
-
19
-
20
-
21
-
22
-
23
-
24
-
25
-
26
-
27
-
28
-
29
-
30
-
31
-
32
-
33
-
34
-
35
-
36
-
37
-
38
-
39
-
40
-
41
-
42
-
43
-
44
-
45
-
46
-
47
-
48
-
49
-
50
-
51
-
52
-
53
-
54
-
55
-
56
-
57
-
 58
58 -
 59
59 -
 60
60 -
 61
61 -
 62
62 -
 63
63 -
 64
64 -
 65
65 -
 66
66 -
 67
67 -
 68
68 -
 69
69 -
 70
70 -
 71
71 -
 72
72 -
 73
73 -
 74
74 -
 75
75 -
 76
76 -
 77
77 -
 78
78 -
79
-
80
-
81
-
82
-
83
-
84
-
85
-
86
-
87
-
88
-
89
-
90
-
91
-
92
-
93
-
94
-
95
-
96
-
97
-
98
-
99
-
100
-
101
-
102
-
103
-
104
-
105
-
106
-
107
-
108
-
109
-
110
-
111
-
112
-
113
-
114
-
115
-
116
-
117
-
118
-
119
-
120
-
121
-
122
-
123
-
124
-
125
-
126
-
127
-
128
-
129
-
130
-
131
-
132
-
133
-
134
-
135
-
136
-
137
-
138
-
139
-
140
-
141
-
142
-
143
-
144
-
145
-
146
-
147
-
148
-
149
-
150
-
151
-
152
-
153
-
154
-
155
-
156
-
157
-
158
-
159
-
160
-
161
-
162
-
163
-
164
-
165
-
166
-
167
-
168
-
169
-
170
-
171
-
172
-
173
-
174
-
175
-
176
-
177
-
178
 |
 |

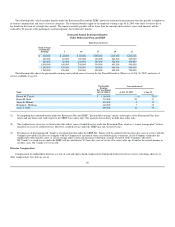
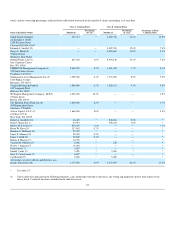
stock), and the ownership percentages reflected in the table below are based on the number of shares outstanding as of such date.
Class A Common Stock Class B Common Stock
Name of Beneficial Owner Number(1)
Percentage
of Class Number(1)
Percentage
of Class
Percentage of Total
Common Stock
Smith Family Group(2)
c/o Richard A. Smith
1280 Boylston Street
Chestnut Hill, MA 02467
127,471 * 6,027,336 31.0% 12.5%
Richard A. Smith(1)(2) — — 3,422,370 17.6% 7.0%
Nancy L. Marks(2)
57 River Street
Wellesley, MA 02481
— — 2,683,609 13.8% 5.5%
Gabelli Funds, LLC(3)
One Corporate Center
Rye, NY 10580
887,034 3.0% 2,934,149 15.1% 7.8%
PRIMECAP Management Company(4)
225 South Lake Avenue
Pasadena, CA 91101
2,642,239 8.3% 1,491,425 7.7% 8.1%
Southeastern Asset Management, Inc.(5)
6410 Poplar Avenue
Memphis, TN 38119
1,789,500 6.1% 1,733,500 8.9% 7.2%
Vanguard/Primecap Fund(6)
100 Vanguard Blvd.
Malvern, PA 19355
1,800,000 6.1% 1,028,811 5.3% 5.8%
Wellington Management Company, LLP(7)
75 State Street
Boston, MA 02109
3,023,400 10.2% — — 6.2%
The Hartford Series Fund, Inc.(8)
200 Hopmeadow Street
Simsbury, CT 06089
1,830,200 6.2% — — 3.7%
Atticus Capital, L.L.C.(9)
152 West 57th St.
New York, NY 10019
1,660,000 5.6% — — 3.4%
Robert A. Smith(2)(10) 63,480 * 548,681 2.8% *
Brian J. Knez(2)(11) 63,991 * 358,638 1.8% *
Burton M. Tansky(12) 545,647 1.8% — — 1.1%
Karen W. Katz(13) 217,862 0.7% — — *
Brendan L. Hoffman(14) 27,970 * — — *
James E. Skinner(15) 98,780 0.3% — — *
James J. Gold(16) 39,840 0.1% — — *
Matina S. Horner(17) 14,796 * — — *
Vincent M. O'Reilly(17) 6,060 * 218 * *
Walter J. Salmon(17) 15,202 * — — *
Paula Stern(17) 5,663 * — * *
John R. Cook(17) 3,029 * 3,000 * *
Gary L. Countryman(17) 6,827 * — — *
Carl Sewell(17) 2,248 * 5,000 * *
All current executive officers and directors as a
group (18 persons)(18) 1,177,960 3.9% 4,337,907 22.3% 11.6%
Less than 1%.
Unless otherwise indicated in the following footnotes, each stockholder referred to above has sole voting and dispositive power with respect to the
shares listed. Certain of the shares included in the table have been
65
*
(1)