Neiman Marcus 2004 Annual Report Download - page 32
Download and view the complete annual report
Please find page 32 of the 2004 Neiman Marcus annual report below. You can navigate through the pages in the report by either clicking on the pages listed below, or by using the keyword search tool below to find specific information within the annual report.-
 1
1 -
2
-
3
-
4
-
5
-
6
-
7
-
8
-
9
-
10
-
11
-
12
-
13
-
14
-
15
-
16
-
17
-
18
-
19
-
20
-
21
-
 22
22 -
 23
23 -
 24
24 -
 25
25 -
 26
26 -
 27
27 -
 28
28 -
 29
29 -
 30
30 -
 31
31 -
 32
32 -
 33
33 -
 34
34 -
 35
35 -
 36
36 -
 37
37 -
 38
38 -
 39
39 -
 40
40 -
 41
41 -
 42
42 -
43
-
44
-
45
-
46
-
47
-
48
-
49
-
50
-
51
-
52
-
53
-
54
-
55
-
56
-
57
-
58
-
59
-
60
-
61
-
62
-
63
-
64
-
65
-
66
-
67
-
68
-
69
-
70
-
71
-
72
-
73
-
74
-
75
-
76
-
77
-
78
-
79
-
80
-
81
-
82
-
83
-
84
-
85
-
86
-
87
-
88
-
89
-
90
-
91
-
92
-
93
-
94
-
95
-
96
-
97
-
98
-
99
-
100
-
101
-
102
-
103
-
104
-
105
-
106
-
107
-
108
-
109
-
110
-
111
-
112
-
113
-
114
-
115
-
116
-
117
-
118
-
119
-
120
-
121
-
122
-
123
-
124
-
125
-
126
-
127
-
128
-
129
-
130
-
131
-
132
-
133
-
134
-
135
-
136
-
137
-
138
-
139
-
140
-
141
-
142
-
143
-
144
-
145
-
146
-
147
-
148
-
149
-
150
-
151
-
152
-
153
-
154
-
155
-
156
-
157
-
158
-
159
-
160
-
161
-
162
-
163
-
164
-
165
-
166
-
167
-
168
-
169
-
170
-
171
-
172
-
173
-
174
-
175
-
176
-
177
-
178
 |
 |

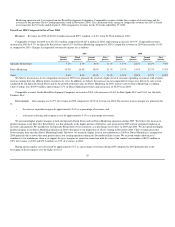
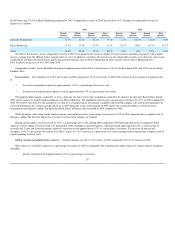
Retail Stores and 19.2% for Direct Marketing compared to 2003. Comparable revenues in 2003 increased by 4.1%. Changes in comparable revenues by
quarter are as follows:
2004 2003
Fourth
Quarter
Third
Quarter
Second
Quarter
First
Quarter
Fourth
Quarter
Third
Quarter
Second
Quarter
First
Quarter
Specialty Retail Stores 11.3% 22.2% 10.2% 9.6% 6.3% (0.6)% (2.1)% 5.0%
Direct Marketing 21.7% 14.4% 25.7% 13.2% 22.3% 14.8% 18.7% 15.7%
Total 12.6% 22.0% 12.7% 10.9% 9.0% 1.6% 0.9% 6.3%
We believe the increases in our comparable revenues in 2004 were primarily the result of a higher level of consumer spending, in general, with a higher
increase coming from the affluent luxury customer that we serve. In addition, we believe the increases in our comparable revenues were driven by sales events
conducted by our Specialty Retail Stores and by the growth of internet sales for Direct Marketing. In 2004, internet sales by Direct Marketing were
$241.8 million, an increase of over 50% from 2003.
Comparable revenues for the Brand Development Companies increased in 2004, with increases of 40.3% for Kate Spade LLC and 17.8% for Gurwitch
Products, LLC.
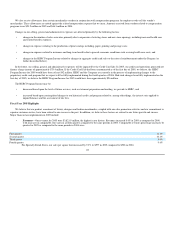
Gross margin. Gross margin was 34.0% of revenues in 2004 compared to 32.5% of revenues in 2003. The increase in gross margin was primarily due
to:
the increase in product margins by approximately 1.0% as a percentage of revenues; and
the decrease in buying and occupancy costs by approximately 0.5% as a percentage of revenues.
The higher product margins realized by us were a function of a lower level of net markdowns required to be taken by the Specialty Retail Stores during
2004, offset, in part, by slightly higher markdowns for Direct Marketing. Net markdowns decreased as a percentage of revenues by 0.7% in 2004 compared to
2003. We believe the lower level of markdowns was due to 1) an improvement in economic conditions that resulted in higher sales and the discontinuance of
various promotional sales activities conducted by us in 2003, primarily in the second quarter of 2003 and 2) our continued emphasis on both inventory
management and full-price selling. For Specialty Retail Stores, full-price sales increased in 2004 compared to 2003.
While the dollar value of the vendor reimbursements received decreased as a percentage of revenues by 0.5% in 2004, primarily due to a higher level of
full-price selling, this decrease did not have an adverse effect on the margins we realized.
Buying and occupancy costs decreased by 0.5% as a percentage of revenues during 2004 compared to 2003 primarily due to the leveraging of fixed
expenses over the higher level of revenues we generated in 2004, including 1) payroll expenses, which decreased approximately 0.2% as a percentage of
revenues and 2) rent and related occupancy expenses, which decreased approximately 0.3% as a percentage of revenues. The decrease in buying and
occupancy costs as a percentage of revenues was offset, in part, by a 0.1% increase as a percentage of revenues in depreciation expense due to higher levels of
capital spending in recent years.
Selling, general and administrative expenses. SG&A expenses were 24.1% of revenues in 2004 compared to 25.3% of revenues in 2003.
The net decrease in SG&A expenses as a percentage of revenues in 2004 was primarily due to productivity improvements in various expense categories,
including:
payroll, which decreased approximately 0.8% as a percentage of revenues;
29
•
•
•