Neiman Marcus 2004 Annual Report Download - page 82
Download and view the complete annual report
Please find page 82 of the 2004 Neiman Marcus annual report below. You can navigate through the pages in the report by either clicking on the pages listed below, or by using the keyword search tool below to find specific information within the annual report.-
 1
1 -
2
-
3
-
4
-
5
-
6
-
7
-
8
-
9
-
10
-
11
-
12
-
13
-
14
-
15
-
16
-
17
-
18
-
19
-
20
-
21
-
22
-
23
-
24
-
25
-
26
-
27
-
28
-
29
-
30
-
31
-
32
-
33
-
34
-
35
-
36
-
37
-
38
-
39
-
40
-
41
-
42
-
43
-
44
-
45
-
46
-
47
-
48
-
49
-
50
-
51
-
52
-
53
-
54
-
55
-
56
-
57
-
58
-
59
-
60
-
61
-
62
-
63
-
64
-
65
-
66
-
67
-
68
-
69
-
70
-
71
-
 72
72 -
 73
73 -
 74
74 -
 75
75 -
 76
76 -
 77
77 -
 78
78 -
 79
79 -
 80
80 -
 81
81 -
 82
82 -
 83
83 -
 84
84 -
 85
85 -
 86
86 -
 87
87 -
 88
88 -
 89
89 -
 90
90 -
 91
91 -
 92
92 -
93
-
94
-
95
-
96
-
97
-
98
-
99
-
100
-
101
-
102
-
103
-
104
-
105
-
106
-
107
-
108
-
109
-
110
-
111
-
112
-
113
-
114
-
115
-
116
-
117
-
118
-
119
-
120
-
121
-
122
-
123
-
124
-
125
-
126
-
127
-
128
-
129
-
130
-
131
-
132
-
133
-
134
-
135
-
136
-
137
-
138
-
139
-
140
-
141
-
142
-
143
-
144
-
145
-
146
-
147
-
148
-
149
-
150
-
151
-
152
-
153
-
154
-
155
-
156
-
157
-
158
-
159
-
160
-
161
-
162
-
163
-
164
-
165
-
166
-
167
-
168
-
169
-
170
-
171
-
172
-
173
-
174
-
175
-
176
-
177
-
178
 |
 |
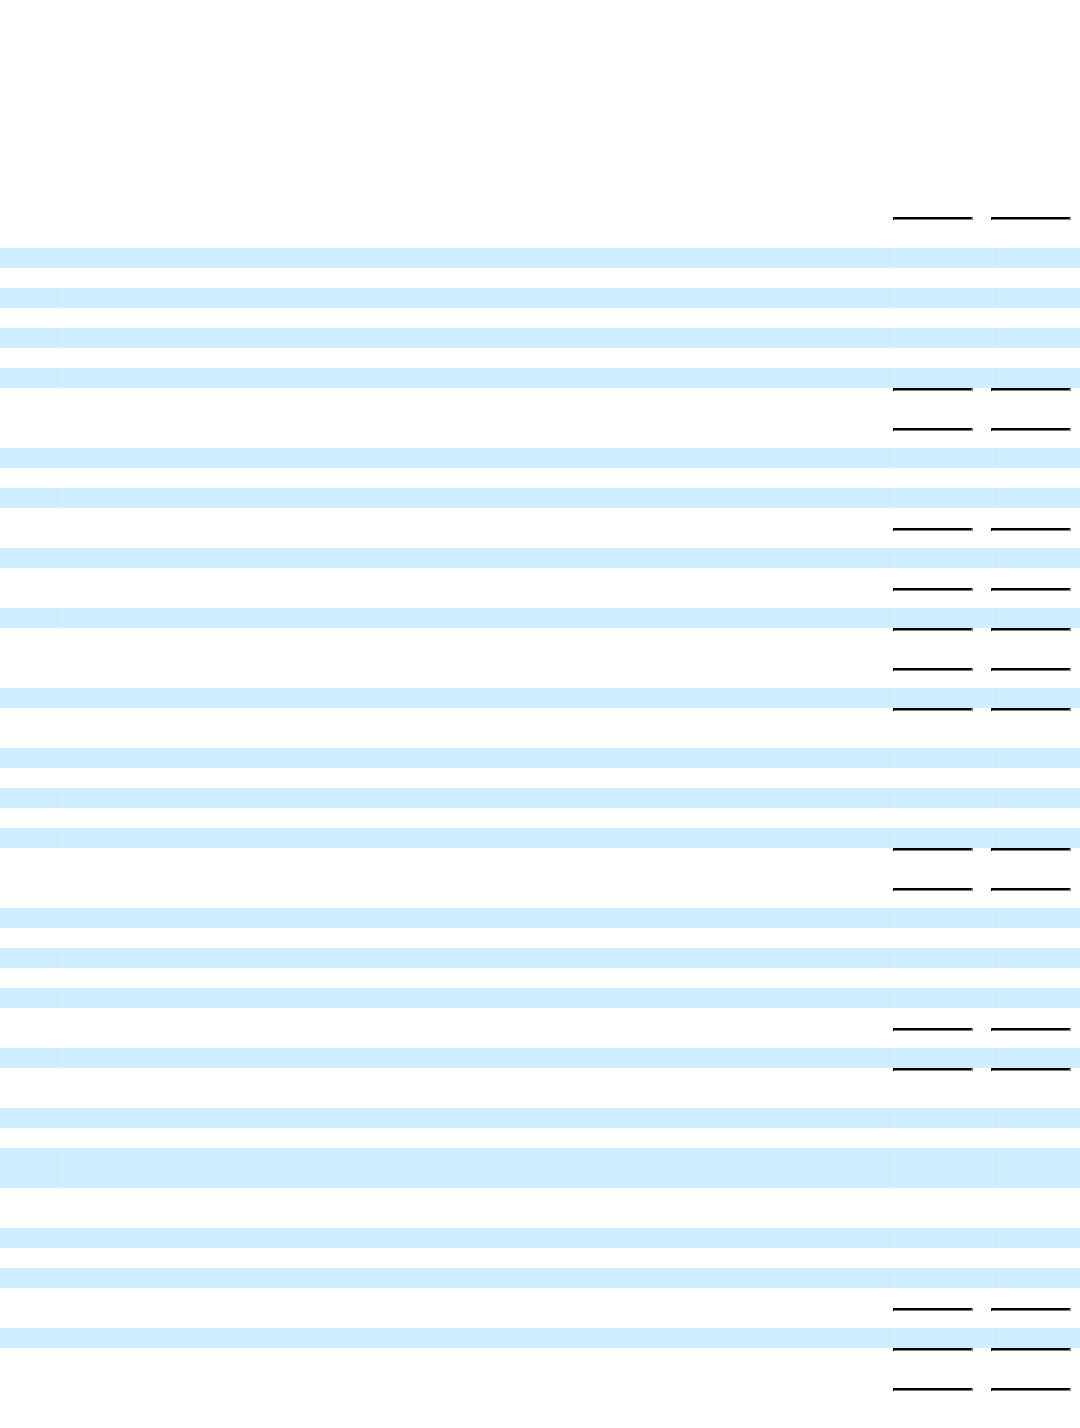
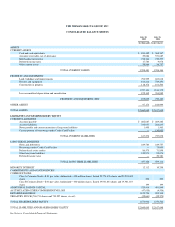
THE NEIMAN MARCUS GROUP, INC.
CONSOLIDATED BALANCE SHEETS
July 30,
2005
July 31,
2004
(in thousands, except shares)
ASSETS
CURRENT ASSETS
Cash and cash equivalents $ 853,482 $ 368,367
Accounts receivable, net of allowance 29,886 551,687
Merchandise inventories 748,366 720,277
Deferred income taxes 17,783 9,078
Other current assets 58,964 56,757
TOTAL CURRENT ASSETS 1,708,481 1,706,166
PROPERTY AND EQUIPMENT
Land, buildings and improvements 794,559 683,618
Fixtures and equipment 814,216 729,250
Construction in progress 118,376 101,504
1,727,151 1,514,372
Less accumulated depreciation and amortization 872,142 763,889
PROPERTY AND EQUIPMENT, NET 855,009 750,483
OTHER ASSETS 97,170 160,999
TOTAL ASSETS $2,660,660 $2,617,648
LIABILITIES AND SHAREHOLDERS' EQUITY
CURRENT LIABILITIES
Accounts payable $ 282,887 $ 289,282
Accrued liabilities 332,937 286,833
Notes payable and current maturities of long-term liabilities 1,450 1,563
Current portion of borrowings under Credit Card Facility — 150,000
TOTAL CURRENT LIABILITIES 617,274 727,678
LONG-TERM LIABILITIES
Notes and debentures 249,780 249,757
Borrowings under Credit Card Facility — 75,000
Deferred real estate credits 86,575 71,898
Other long-term liabilities 120,973 92,074
Deferred income taxes — 20,381
TOTAL LONG-TERM LIABILITIES 457,328 509,110
MINORITY INTEREST 12,112 10,298
COMMITMENTS AND CONTINGENCIES
COMMON STOCKS
Class A Common Stock—$.01 par value; Authorized—100 million shares; Issued 29,774,476 shares and 29,294,405
shares 298 293
Class B Common Stock—$.01 par value; Authorized—100 million shares; Issued 19,941,833 shares and 19,941,833
shares 199 199
ADDITIONAL PAID-IN CAPITAL 520,414 491,849
ACCUMULATED OTHER COMPREHENSIVE LOSS (47,030) (4,536)
RETAINED EARNINGS 1,125,726 905,330
TREASURY STOCK (768,731 shares and 710,227 shares, at cost) (25,661) (22,573)
TOTAL SHAREHOLDERS' EQUITY 1,573,946 1,370,562
TOTAL LIABILITIES AND SHAREHOLDERS' EQUITY $2,660,660 $2,617,648
See Notes to Consolidated Financial Statements.