Neiman Marcus 2004 Annual Report Download - page 85
Download and view the complete annual report
Please find page 85 of the 2004 Neiman Marcus annual report below. You can navigate through the pages in the report by either clicking on the pages listed below, or by using the keyword search tool below to find specific information within the annual report.-
 1
1 -
2
-
3
-
4
-
5
-
6
-
7
-
8
-
9
-
10
-
11
-
12
-
13
-
14
-
15
-
16
-
17
-
18
-
19
-
20
-
21
-
22
-
23
-
24
-
25
-
26
-
27
-
28
-
29
-
30
-
31
-
32
-
33
-
34
-
35
-
36
-
37
-
38
-
39
-
40
-
41
-
42
-
43
-
44
-
45
-
46
-
47
-
48
-
49
-
50
-
51
-
52
-
53
-
54
-
55
-
56
-
57
-
58
-
59
-
60
-
61
-
62
-
63
-
64
-
65
-
66
-
67
-
68
-
69
-
70
-
71
-
72
-
73
-
74
-
 75
75 -
 76
76 -
 77
77 -
 78
78 -
 79
79 -
 80
80 -
 81
81 -
 82
82 -
 83
83 -
 84
84 -
 85
85 -
 86
86 -
 87
87 -
 88
88 -
 89
89 -
 90
90 -
 91
91 -
 92
92 -
 93
93 -
 94
94 -
 95
95 -
96
-
97
-
98
-
99
-
100
-
101
-
102
-
103
-
104
-
105
-
106
-
107
-
108
-
109
-
110
-
111
-
112
-
113
-
114
-
115
-
116
-
117
-
118
-
119
-
120
-
121
-
122
-
123
-
124
-
125
-
126
-
127
-
128
-
129
-
130
-
131
-
132
-
133
-
134
-
135
-
136
-
137
-
138
-
139
-
140
-
141
-
142
-
143
-
144
-
145
-
146
-
147
-
148
-
149
-
150
-
151
-
152
-
153
-
154
-
155
-
156
-
157
-
158
-
159
-
160
-
161
-
162
-
163
-
164
-
165
-
166
-
167
-
168
-
169
-
170
-
171
-
172
-
173
-
174
-
175
-
176
-
177
-
178
 |
 |
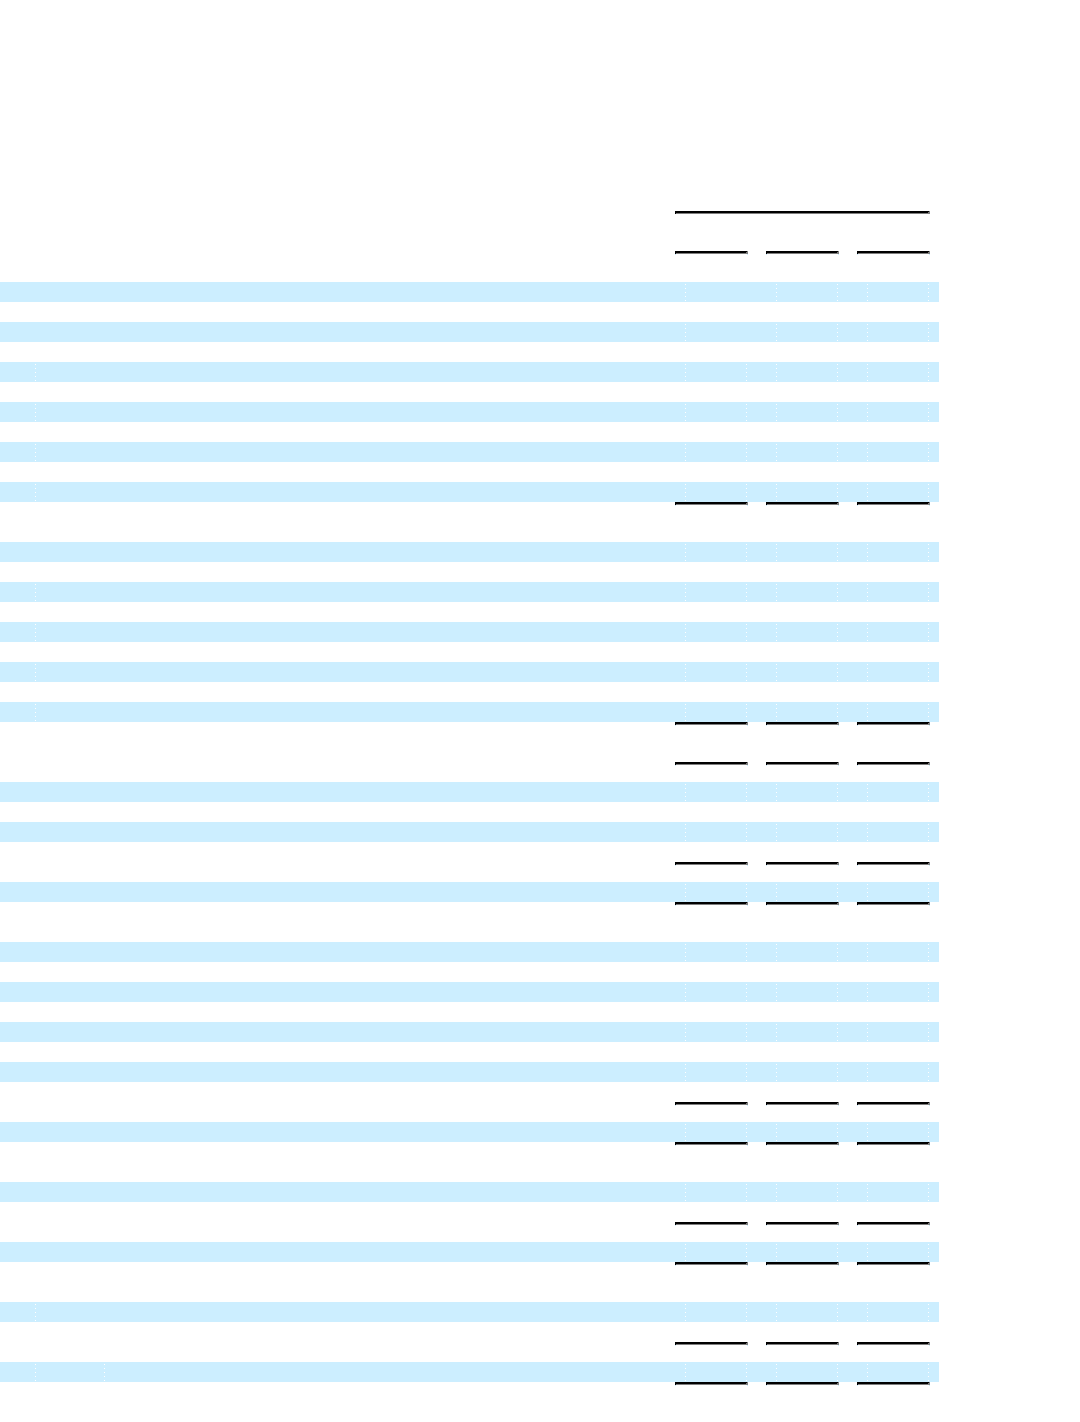
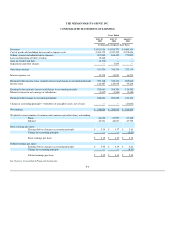
THE NEIMAN MARCUS GROUP, INC.
CONSOLIDATED STATEMENTS OF CASH FLOWS
Years Ended
July 30,
2005
July 31,
2004
August 2,
2003
(in thousands)
CASH FLOWS—OPERATING ACTIVITIES
Net earnings $ 248,824 $ 204,832 $ 109,303
Adjustments to reconcile net earnings to net cash provided by operating activities:
Depreciation 107,687 99,042 82,878
Deferred income taxes (15,105) 23,274 7,444
Loss on disposition of Chef's Catalog 15,348 — —
Gain on Credit Card Sale (6,170) — —
Net cash received from Credit Card Sale 533,656 — —
Impairment of intangible assets and other charges — 3,853 14,801
Minority interest 3,837 3,549 2,488
Other—primarily costs related to defined benefit pension and other long-term benefit plans 41,633 33,222 24,189
929,710 367,772 241,103
Changes in operating assets and liabilities:
Increase in accounts receivable (71,082) (529,092) (2,817)
Decrease (increase) in undivided interests — 242,565 (33,963)
Increase in merchandise inventories (38,074) (33,215) (30,218)
(Increase) decrease in other current assets (6,161) 12,026 (22,135)
Decrease (increase) in other assets 10,743 (4,454) (10,735)
Increase in accounts payable and accrued liabilities 24,864 40,414 17,770
Increase in deferred real estate credits 15,400 1,556 36,407
Funding of defined benefit pension plan (20,000) (45,000) (30,760)
Net cash provided by operating activities 845,400 52,572 164,652
CASH FLOWS—INVESTING ACTIVITIES
Capital expenditures (202,535) (120,473) (129,568)
Net increase in cash restricted for repayment of borrowings under Credit Card Facility (40,713) — —
Proceeds from sale of Chef's Catalog and other assets 14,419 3,183 —
Net cash used for investing activities (228,829) (117,290) (129,568)
CASH FLOWS—FINANCING ACTIVITIES
Proceeds from borrowings 10,000 2,750 81,051
Repayment of debt (10,113) (1,500) (81,051)
Borrowings under Credit Card Facility — 225,000 —
Repayment of borrowings under Credit Card Facility (112,500) — —
Acquisition of treasury stock (3,088) (7,553) (15,020)
Cash dividends paid (27,398) (12,632) —
Distributions paid (4,457) (3,727) (2,432)
Proceeds from exercises of stock options and restricted stock grants 16,100 23,797 10,680
Net cash (used for) provided by financing activities (131,456) 226,135 (6,772)
CASH AND CASH EQUIVALENTS
Increase during the year 485,115 161,417 28,312
Beginning balance 368,367 206,950 178,638
Ending balance $ 853,482 $ 368,367 $ 206,950
Supplemental Schedule of Cash Flow Information:
Cash paid during the year for:
Interest $ 22,717 $ 17,833 $ 18,071
Income taxes $ 144,626 $ 104,742 $ 61,860
Noncash activities: