Neiman Marcus 2004 Annual Report Download - page 28
Download and view the complete annual report
Please find page 28 of the 2004 Neiman Marcus annual report below. You can navigate through the pages in the report by either clicking on the pages listed below, or by using the keyword search tool below to find specific information within the annual report.-
 1
1 -
2
-
3
-
4
-
5
-
6
-
7
-
8
-
9
-
10
-
11
-
12
-
13
-
14
-
15
-
16
-
17
-
 18
18 -
 19
19 -
 20
20 -
 21
21 -
 22
22 -
 23
23 -
 24
24 -
 25
25 -
 26
26 -
 27
27 -
 28
28 -
 29
29 -
 30
30 -
 31
31 -
 32
32 -
 33
33 -
 34
34 -
 35
35 -
 36
36 -
 37
37 -
 38
38 -
39
-
40
-
41
-
42
-
43
-
44
-
45
-
46
-
47
-
48
-
49
-
50
-
51
-
52
-
53
-
54
-
55
-
56
-
57
-
58
-
59
-
60
-
61
-
62
-
63
-
64
-
65
-
66
-
67
-
68
-
69
-
70
-
71
-
72
-
73
-
74
-
75
-
76
-
77
-
78
-
79
-
80
-
81
-
82
-
83
-
84
-
85
-
86
-
87
-
88
-
89
-
90
-
91
-
92
-
93
-
94
-
95
-
96
-
97
-
98
-
99
-
100
-
101
-
102
-
103
-
104
-
105
-
106
-
107
-
108
-
109
-
110
-
111
-
112
-
113
-
114
-
115
-
116
-
117
-
118
-
119
-
120
-
121
-
122
-
123
-
124
-
125
-
126
-
127
-
128
-
129
-
130
-
131
-
132
-
133
-
134
-
135
-
136
-
137
-
138
-
139
-
140
-
141
-
142
-
143
-
144
-
145
-
146
-
147
-
148
-
149
-
150
-
151
-
152
-
153
-
154
-
155
-
156
-
157
-
158
-
159
-
160
-
161
-
162
-
163
-
164
-
165
-
166
-
167
-
168
-
169
-
170
-
171
-
172
-
173
-
174
-
175
-
176
-
177
-
178
 |
 |

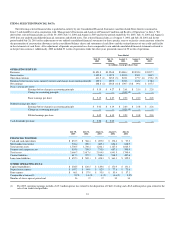
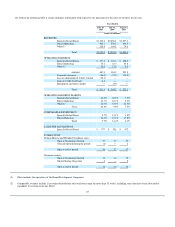
Set forth in the following table is certain summary information with respect to our operations for the most recent three fiscal years.
Years Ended
July 30,
2005
July 31,
2004
August 2,
2003
(dollars in millions)
REVENUES
Specialty Retail Stores $3,103.0 $2,850.1 $2,507.1
Direct Marketing 592.1 570.6 493.5
Other(1) 126.8 104.1 79.8
Total $3,821.9 $3,524.8 $3,080.4
OPERATING EARNINGS
Specialty Retail Stores $ 377.8 $ 310.6 $ 198.2
Direct Marketing 75.2 61.3 45.8
Other(1) 14.0 13.0 9.0
subtotal 467.0 384.9 253.0
Corporate expenses (46.4) (35.8) (30.9)
Loss on disposition of Chef's Catalog (15.3) — —
Gain on Credit Card Sale 6.2 — —
Impairment and other charges — (3.9) —
Total $ 411.5 $ 345.2 $ 222.1
OPERATING EARNINGS MARGIN
Specialty Retail Stores 12.2% 10.9% 7.9%
Direct Marketing 12.7% 10.7% 9.3%
Other(1) 11.0% 12.5% 11.3%
Total 10.8% 9.8% 7.2%
COMPARABLE REVENUES(2)
Specialty Retail Stores 8.7% 13.1% 1.8%
Direct Marketing 16.3% 19.2% 17.8%
Total 9.9% 14.4% 4.1%
SALES PER SQUARE FOOT
Specialty Retail Stores $ 577 $ 528 $ 472
STORE COUNT
Neiman Marcus and Bergdorf Goodman stores:
Open at beginning of period 37 37 35
(Closed) opened during the period (1) — 2
Open at end of period 36 37 37
Clearance centers:
Open at beginning of period 14 14 12
Opened during the period 2 — 2
Open at end of period 16 14 14
Other includes the operations of the Brand Development Companies.
Comparable revenues include 1) revenues derived from our retail stores open for more than 52 weeks, including stores that have been relocated or
expanded, 2) revenues from our Direct
25
(1)
(2)