Neiman Marcus 2004 Annual Report Download - page 34
Download and view the complete annual report
Please find page 34 of the 2004 Neiman Marcus annual report below. You can navigate through the pages in the report by either clicking on the pages listed below, or by using the keyword search tool below to find specific information within the annual report.-
 1
1 -
2
-
3
-
4
-
5
-
6
-
7
-
8
-
9
-
10
-
11
-
12
-
13
-
14
-
15
-
16
-
17
-
18
-
19
-
20
-
21
-
22
-
23
-
 24
24 -
 25
25 -
 26
26 -
 27
27 -
 28
28 -
 29
29 -
 30
30 -
 31
31 -
 32
32 -
 33
33 -
 34
34 -
 35
35 -
 36
36 -
 37
37 -
 38
38 -
 39
39 -
 40
40 -
 41
41 -
 42
42 -
 43
43 -
 44
44 -
45
-
46
-
47
-
48
-
49
-
50
-
51
-
52
-
53
-
54
-
55
-
56
-
57
-
58
-
59
-
60
-
61
-
62
-
63
-
64
-
65
-
66
-
67
-
68
-
69
-
70
-
71
-
72
-
73
-
74
-
75
-
76
-
77
-
78
-
79
-
80
-
81
-
82
-
83
-
84
-
85
-
86
-
87
-
88
-
89
-
90
-
91
-
92
-
93
-
94
-
95
-
96
-
97
-
98
-
99
-
100
-
101
-
102
-
103
-
104
-
105
-
106
-
107
-
108
-
109
-
110
-
111
-
112
-
113
-
114
-
115
-
116
-
117
-
118
-
119
-
120
-
121
-
122
-
123
-
124
-
125
-
126
-
127
-
128
-
129
-
130
-
131
-
132
-
133
-
134
-
135
-
136
-
137
-
138
-
139
-
140
-
141
-
142
-
143
-
144
-
145
-
146
-
147
-
148
-
149
-
150
-
151
-
152
-
153
-
154
-
155
-
156
-
157
-
158
-
159
-
160
-
161
-
162
-
163
-
164
-
165
-
166
-
167
-
168
-
169
-
170
-
171
-
172
-
173
-
174
-
175
-
176
-
177
-
178
 |
 |

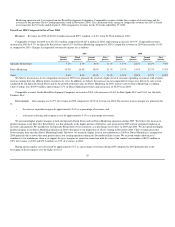
primarily the result of increased revenues, reduced markdowns and net decreases in both buying and occupancy expenses and SG&A expenses as percentages
of revenues.
Operating earnings for Direct Marketing increased to $61.3 million in 2004 from $45.8 million for the prior year period, primarily as a result of increased
revenues and net decreases in both buying and occupancy costs and SG&A expenses as a percentage of revenues offset, in part, by slightly higher markdowns.
Interest expense, net. Net interest expense was $15.9 million in 2004 and $16.3 million in the prior year. The decrease in net interest expense was
primarily due to increases in both capitalized interest charges associated with store construction and remodeling activities and higher interest income.
The decrease in net interest expense was offset, in part, by an increase in the interest expense attributable to the monthly interest distributions to the
holders of the Sold Interests that began to be charged to interest expense in December 2003 as a result of the discontinuance of Off-Balance Sheet
Accounting.
As a result of a higher level of cash generated by operations, we incurred no borrowings on our revolving credit facility to fund seasonal working capital
requirements in 2004. Seasonal borrowings under our revolving credit facility reached $80 million in the second quarter of 2003 and were repaid prior to the
end of the quarter.
Income taxes. Our effective income tax rate was 36.7% for 2004 and 38.5% for 2003. In the second quarter of 2004, we recognized a net income tax
benefit of $7.5 million related to favorable settlements associated with previous state tax filings. Excluding this benefit, our effective tax rate was 39.0% for
2004 as compared to 38.5% for 2003. This increase in our effective tax rate was primarily due to higher state income taxes.
Inflation and Deflation
We believe changes in revenues and net earnings that have resulted from inflation or deflation have not been material during the periods presented. In
recent years, we have experienced certain inflationary conditions in our cost base due primarily to 1) changes in foreign currency exchange rates that have
reduced the purchasing power of the U.S. dollar and 2) increases in SG&A, particularly with regard to employee benefits.
We purchase a substantial portion of our inventory from foreign suppliers whose costs are affected by the fluctuation of their local currency against the
dollar or who price their merchandise in currencies other than the dollar. Accordingly, changes in the value of the dollar relative to foreign currencies may
increase our cost of goods sold and if we are unable to pass such cost increases to our customers, our gross margins, and ultimately our earnings, would
decrease. Fluctuations in the euro-U.S. dollar exchange rate affect us most significantly; however, we source goods from numerous countries and thus are
affected by changes in numerous currencies and, generally, by fluctuations in the U.S. dollar relative to such currencies. Although we hedge some exposures
to changes in foreign currency exchange rates arising in the ordinary course of business, foreign currency fluctuations could have a material adverse effect on
our business, financial condition and results of operations in the future.
We attempt to offset the effects of inflation through control of expenses and price increases, although our ability to increase prices may be limited by
competitive factors. We attempt to offset the effects of merchandise deflation, which has occurred on a limited basis in recent years, through control of
expenses. There is no assurance, however, that inflation or deflation will not materially affect our operations in the future.
31