Neiman Marcus 2004 Annual Report Download - page 104
Download and view the complete annual report
Please find page 104 of the 2004 Neiman Marcus annual report below. You can navigate through the pages in the report by either clicking on the pages listed below, or by using the keyword search tool below to find specific information within the annual report.-
 1
1 -
2
-
3
-
4
-
5
-
6
-
7
-
8
-
9
-
10
-
11
-
12
-
13
-
14
-
15
-
16
-
17
-
18
-
19
-
20
-
21
-
22
-
23
-
24
-
25
-
26
-
27
-
28
-
29
-
30
-
31
-
32
-
33
-
34
-
35
-
36
-
37
-
38
-
39
-
40
-
41
-
42
-
43
-
44
-
45
-
46
-
47
-
48
-
49
-
50
-
51
-
52
-
53
-
54
-
55
-
56
-
57
-
58
-
59
-
60
-
61
-
62
-
63
-
64
-
65
-
66
-
67
-
68
-
69
-
70
-
71
-
72
-
73
-
74
-
75
-
76
-
77
-
78
-
79
-
80
-
81
-
82
-
83
-
84
-
85
-
86
-
87
-
88
-
89
-
90
-
91
-
92
-
93
-
 94
94 -
 95
95 -
 96
96 -
 97
97 -
 98
98 -
 99
99 -
 100
100 -
 101
101 -
 102
102 -
 103
103 -
 104
104 -
 105
105 -
 106
106 -
 107
107 -
 108
108 -
 109
109 -
 110
110 -
 111
111 -
 112
112 -
 113
113 -
 114
114 -
115
-
116
-
117
-
118
-
119
-
120
-
121
-
122
-
123
-
124
-
125
-
126
-
127
-
128
-
129
-
130
-
131
-
132
-
133
-
134
-
135
-
136
-
137
-
138
-
139
-
140
-
141
-
142
-
143
-
144
-
145
-
146
-
147
-
148
-
149
-
150
-
151
-
152
-
153
-
154
-
155
-
156
-
157
-
158
-
159
-
160
-
161
-
162
-
163
-
164
-
165
-
166
-
167
-
168
-
169
-
170
-
171
-
172
-
173
-
174
-
175
-
176
-
177
-
178
 |
 |

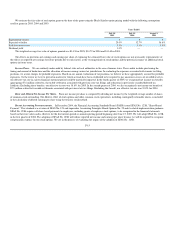
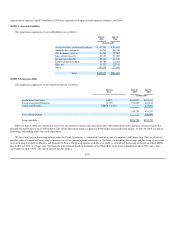
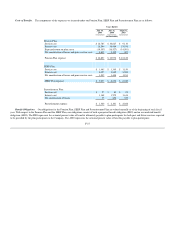
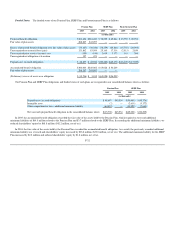
A reconciliation of income tax expense to the amount calculated based on the federal and state statutory rates is as follows:
Years Ended
July 30,
2005
July 31,
2004
August 2,
2003
(in thousands)
Income tax expense at statutory rate $139,702 $115,260 $72,044
State income taxes, net of federal income tax benefit 14,006 12,925 7,354
Tax benefit related to favorable state tax settlements and reductions in deferred tax liabilities (7,585) (7,500) —
Other 364 247 (150)
Total $146,487 $120,932 $79,248
Our effective income tax rate was 36.7% for 2005, 36.7% for 2004 and 38.5% for 2003. In the fourth quarter of 2005, we recognized tax benefits
aggregating $7.6 million related to a favorable settlement associated with previous state tax filings and reductions in previously recorded deferred tax
liabilities. Excluding these benefits, our effective tax rate was 38.6% for 2005. In the second quarter of 2004, we also recognized a tax benefit of $7.5 million
related to favorable settlements associated with previous state tax filings. Excluding this benefit, our effective tax rate was 39.0% for 2004.
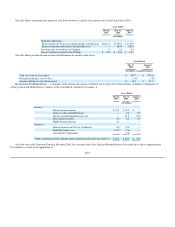
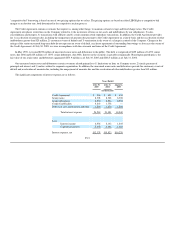
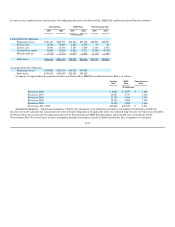
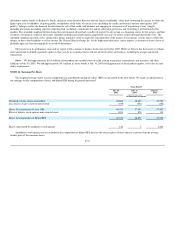
Significant components of our net deferred income tax asset are as follows:
July 30,
2005
July 31,
2004
(in thousands)
Deferred income tax assets:
Accruals and reserves $ 24,140 $ 27,618
Employee benefits 52,794 42,891
Pension obligation 6,327 —
Other 2,035 2,629
Total deferred tax assets 85,296 73,138
Deferred income tax liabilities:
Inventory (11,674) (10,951)
Depreciation and amortization (39,343) (49,133)
Pension obligation — (17,517)
Other (3,610) (6,840)
Total deferred tax liabilities (54,627) (84,441)
Net deferred income tax asset (liability) $ 30,669 $(11,303)
Net deferred income tax asset (liability):
Current $ 17,783 $ 9,078
Non-current 12,886 (20,381)
Total $ 30,669 $(11,303)
F-25