Neiman Marcus 2004 Annual Report Download - page 29
Download and view the complete annual report
Please find page 29 of the 2004 Neiman Marcus annual report below. You can navigate through the pages in the report by either clicking on the pages listed below, or by using the keyword search tool below to find specific information within the annual report.-
 1
1 -
2
-
3
-
4
-
5
-
6
-
7
-
8
-
9
-
10
-
11
-
12
-
13
-
14
-
15
-
16
-
17
-
18
-
 19
19 -
 20
20 -
 21
21 -
 22
22 -
 23
23 -
 24
24 -
 25
25 -
 26
26 -
 27
27 -
 28
28 -
 29
29 -
 30
30 -
 31
31 -
 32
32 -
 33
33 -
 34
34 -
 35
35 -
 36
36 -
 37
37 -
 38
38 -
 39
39 -
40
-
41
-
42
-
43
-
44
-
45
-
46
-
47
-
48
-
49
-
50
-
51
-
52
-
53
-
54
-
55
-
56
-
57
-
58
-
59
-
60
-
61
-
62
-
63
-
64
-
65
-
66
-
67
-
68
-
69
-
70
-
71
-
72
-
73
-
74
-
75
-
76
-
77
-
78
-
79
-
80
-
81
-
82
-
83
-
84
-
85
-
86
-
87
-
88
-
89
-
90
-
91
-
92
-
93
-
94
-
95
-
96
-
97
-
98
-
99
-
100
-
101
-
102
-
103
-
104
-
105
-
106
-
107
-
108
-
109
-
110
-
111
-
112
-
113
-
114
-
115
-
116
-
117
-
118
-
119
-
120
-
121
-
122
-
123
-
124
-
125
-
126
-
127
-
128
-
129
-
130
-
131
-
132
-
133
-
134
-
135
-
136
-
137
-
138
-
139
-
140
-
141
-
142
-
143
-
144
-
145
-
146
-
147
-
148
-
149
-
150
-
151
-
152
-
153
-
154
-
155
-
156
-
157
-
158
-
159
-
160
-
161
-
162
-
163
-
164
-
165
-
166
-
167
-
168
-
169
-
170
-
171
-
172
-
173
-
174
-
175
-
176
-
177
-
178
 |
 |

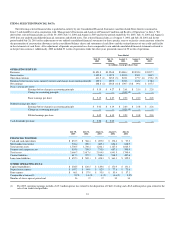
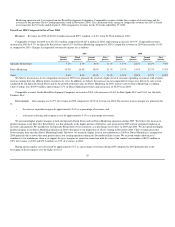
Marketing operation and 3) revenues from our Brand Development Companies. Comparable revenues exclude the revenues of closed stores and the
revenues of our previous Chef's Catalog operations (sold in November 2004). The calculation of the change in comparable revenues for 2003 is based
on revenues for the 52 weeks ended August 2, 2003 compared to revenues for the 52 weeks ended July 27, 2002.
Fiscal Year 2005 Compared to Fiscal Year 2004
Revenues. Revenues for 2005 of $3,821.9 million increased $297.1 million, or 8.4%, from $3,524.8 million in 2004.
Comparable revenues for 2005 were $3,787.8 million compared to $3,447.6 million in 2004, representing an increase of 9.9%. Comparable revenues
increased in 2005 by 8.7% for Specialty Retail Stores and 16.3% for Direct Marketing compared to 2004. Comparable revenues in 2004 increased by 14.4%
as compared to 2003. Changes in comparable revenues by quarter are as follows:
2005 2004
Fourth
Quarter
Third
Quarter
Second
Quarter
First
Quarter
Fourth
Quarter
Third
Quarter
Second
Quarter
First
Quarter
Specialty Retail Stores 7.4% 6.5% 9.6% 11.1% 11.3% 22.2% 10.2% 9.6%
Direct Marketing 19.5% 16.8% 15.8% 13.1% 21.7% 14.4% 25.7% 13.2%
Total 9.6% 8.0% 10.4% 11.4% 12.6% 22.0% 12.7% 10.9%
We believe the increases in our comparable revenues in 2005 were primarily the result of a higher level of consumer spending, in general, with a higher
increase coming from the affluent luxury customers we serve. In addition, we believe the increases in our comparable revenues were driven by sales events
conducted by our Specialty Retail Stores and by the growth of internet sales for Direct Marketing. In 2005, internet sales by Direct Marketing, excluding
Chef's Catalog, were $305.9 million, representing 51.7% of Direct Marketing revenues and an increase of 46.0% from 2004.
Comparable revenues for the Brand Development Companies increased in 2005, with increases of 8.6% for Kate Spade LLC and 15.6% for Gurwitch
Products, LLC.
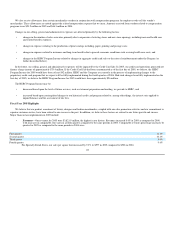
Gross margin. Gross margin was 34.7% of revenues in 2005 compared to 34.0% of revenues in 2004. The increase in gross margin was primarily due
to:
the increase in product margins by approximately 0.6% as a percentage of revenues; and
a decrease in buying and occupancy costs by approximately 0.1% as a percentage of revenues.
We generated higher product margins at both our Specialty Retail Stores and our Direct Marketing operations during 2005. We believe the increase in
product margins at our Specialty Retail Stores was due primarily to the higher portion of full-price sales generated in 2005 and our continued emphasis on
inventory management. Net markdowns for Specialty Retail Stores were consistent, as a percentage of revenues, in 2005 and 2004. We also generated higher
product margins in our Direct Marketing operation in 2005 subsequent to our disposition of Chef's Catalog in November 2004. Chef's Catalog generated
lower margins than our other Direct Marketing brands. However, we incurred a higher level of net markdowns in 2005 for Direct Marketing as compared to
2004 primarily due to lower than anticipated sales in our catalog operations during the December holiday season. We received vendor allowances to
reimburse us for markdowns taken or to support the gross margins we earned in connection with the sales of the vendors' merchandise of $83.5 million, or
2.2% of revenues, in 2005 and $79.3 million, or 2.3% of revenues, in 2004.
Buying and occupancy costs decreased by approximately 0.1% as a percentage of revenues during 2005 compared to 2004 primarily due to the
leveraging of fixed expenses over the higher level of
26
•
•