Neiman Marcus 2004 Annual Report Download - page 26
Download and view the complete annual report
Please find page 26 of the 2004 Neiman Marcus annual report below. You can navigate through the pages in the report by either clicking on the pages listed below, or by using the keyword search tool below to find specific information within the annual report.-
 1
1 -
2
-
3
-
4
-
5
-
6
-
7
-
8
-
9
-
10
-
11
-
12
-
13
-
14
-
15
-
 16
16 -
 17
17 -
 18
18 -
 19
19 -
 20
20 -
 21
21 -
 22
22 -
 23
23 -
 24
24 -
 25
25 -
 26
26 -
 27
27 -
 28
28 -
 29
29 -
 30
30 -
 31
31 -
 32
32 -
 33
33 -
 34
34 -
 35
35 -
 36
36 -
37
-
38
-
39
-
40
-
41
-
42
-
43
-
44
-
45
-
46
-
47
-
48
-
49
-
50
-
51
-
52
-
53
-
54
-
55
-
56
-
57
-
58
-
59
-
60
-
61
-
62
-
63
-
64
-
65
-
66
-
67
-
68
-
69
-
70
-
71
-
72
-
73
-
74
-
75
-
76
-
77
-
78
-
79
-
80
-
81
-
82
-
83
-
84
-
85
-
86
-
87
-
88
-
89
-
90
-
91
-
92
-
93
-
94
-
95
-
96
-
97
-
98
-
99
-
100
-
101
-
102
-
103
-
104
-
105
-
106
-
107
-
108
-
109
-
110
-
111
-
112
-
113
-
114
-
115
-
116
-
117
-
118
-
119
-
120
-
121
-
122
-
123
-
124
-
125
-
126
-
127
-
128
-
129
-
130
-
131
-
132
-
133
-
134
-
135
-
136
-
137
-
138
-
139
-
140
-
141
-
142
-
143
-
144
-
145
-
146
-
147
-
148
-
149
-
150
-
151
-
152
-
153
-
154
-
155
-
156
-
157
-
158
-
159
-
160
-
161
-
162
-
163
-
164
-
165
-
166
-
167
-
168
-
169
-
170
-
171
-
172
-
173
-
174
-
175
-
176
-
177
-
178
 |
 |

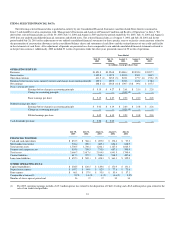
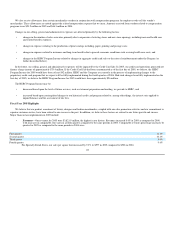
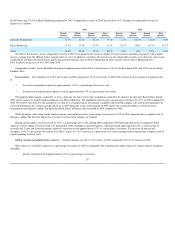
Gross margin—Gross margin increased to 34.7% of our revenues in 2005 from 34.0% in 2004.
Selling, general and administrative expenses—Selling, general and administrative expenses decreased in 2005 to 23.7% of our revenues from
24.1% in 2004.
Operating earnings—Our operating earnings of $411.5 million in 2005 were the highest in our history. Operating earnings increased 19.2% in
2005, representing 10.8% of our revenues in 2005 compared to 9.8% in 2004. Operating earnings for Specialty Retail Stores increased 21.6% in
2005 and represented 12.2% of Specialty Retail Stores revenues. Operating earnings for Direct Marketing increased 22.6% in 2005 and
represented 12.7% of Direct Marketing revenues.
Seasonality
We conduct our selling activities in two primary selling seasons—Fall and Spring. The Fall Season is comprised of our first and second fiscal quarters
and the Spring Season is comprised of our third and fourth fiscal quarters.
Our first quarter is generally characterized by a higher level of full-price selling with a focus on the initial introduction of Fall Season fashions.
Aggressive in-store marketing activities designed to stimulate customer buying, a lower level of markdowns and higher margins are characteristic of this
quarter. The second quarter is more focused on promotional activities related to the December holiday season, the early introduction of resort season
collections from certain designers and the sale of Fall Season goods on a marked down basis. As a result, margins are typically lower in the second quarter.
However, due to the seasonal increase in sales that occurs during the holiday season, the second quarter is typically the quarter in which our revenues are the
highest and in which expenses as a percentage of revenues are the lowest. Our working capital requirements are also the greatest in the first and second
quarters as a result of higher seasonal requirements.
Similarly, the third quarter is generally characterized by a higher level of full-price selling with a focus on the initial introduction of Spring Season
fashions. Aggressive in-store marketing activities designed to stimulate customer buying, a lower level of markdowns and higher margins are again
characteristic of this quarter. Revenues are generally the lowest in the fourth quarter with a focus on promotional activities offering Spring Season goods to
the customer on a marked down basis, resulting in lower margins during the quarter. Our working capital requirements are typically lower in the third and
fourth quarters than in the other quarters.
A large percentage of our merchandise assortment, particularly in the apparel, fashion accessories and shoe categories, is ordered months in advance of
the introduction of such goods. For example, women's apparel, men's apparel and shoes are typically ordered six to nine months in advance of the products
being offered for sale while handbags, jewelry and other categories are typically ordered three to six months in advance. As a result, inherent in the successful
execution of our business plans is our ability both to predict the fashion trends that will be of interest to our customers and to anticipate future spending
patterns of our customer base.
We monitor the sales performance of our inventories throughout each season. We seek to order additional goods to supplement our original purchasing
decisions when the level of customer demand is higher than originally anticipated. However, in certain merchandise categories, particularly fashion apparel,
our ability to purchase additional goods can be limited. This can result in lost sales in the event of higher than anticipated demand of the fashion goods we
offer or a higher than anticipated level of consumer spending. Conversely, in the event we buy fashion goods that are not accepted by the customer or the level
of consumer spending is less than we anticipated, we typically incur a higher than anticipated level of markdowns, net of vendor allowances, to sell the goods
that remain at the end of the season, resulting in lower operating profits. We believe that the experience of our merchandising and selling organizations helps
to minimize the inherent risk in predicting fashion trends.
23
•
•
•