Neiman Marcus 2004 Annual Report Download - page 31
Download and view the complete annual report
Please find page 31 of the 2004 Neiman Marcus annual report below. You can navigate through the pages in the report by either clicking on the pages listed below, or by using the keyword search tool below to find specific information within the annual report.-
 1
1 -
2
-
3
-
4
-
5
-
6
-
7
-
8
-
9
-
10
-
11
-
12
-
13
-
14
-
15
-
16
-
17
-
18
-
19
-
20
-
 21
21 -
 22
22 -
 23
23 -
 24
24 -
 25
25 -
 26
26 -
 27
27 -
 28
28 -
 29
29 -
 30
30 -
 31
31 -
 32
32 -
 33
33 -
 34
34 -
 35
35 -
 36
36 -
 37
37 -
 38
38 -
 39
39 -
 40
40 -
 41
41 -
42
-
43
-
44
-
45
-
46
-
47
-
48
-
49
-
50
-
51
-
52
-
53
-
54
-
55
-
56
-
57
-
58
-
59
-
60
-
61
-
62
-
63
-
64
-
65
-
66
-
67
-
68
-
69
-
70
-
71
-
72
-
73
-
74
-
75
-
76
-
77
-
78
-
79
-
80
-
81
-
82
-
83
-
84
-
85
-
86
-
87
-
88
-
89
-
90
-
91
-
92
-
93
-
94
-
95
-
96
-
97
-
98
-
99
-
100
-
101
-
102
-
103
-
104
-
105
-
106
-
107
-
108
-
109
-
110
-
111
-
112
-
113
-
114
-
115
-
116
-
117
-
118
-
119
-
120
-
121
-
122
-
123
-
124
-
125
-
126
-
127
-
128
-
129
-
130
-
131
-
132
-
133
-
134
-
135
-
136
-
137
-
138
-
139
-
140
-
141
-
142
-
143
-
144
-
145
-
146
-
147
-
148
-
149
-
150
-
151
-
152
-
153
-
154
-
155
-
156
-
157
-
158
-
159
-
160
-
161
-
162
-
163
-
164
-
165
-
166
-
167
-
168
-
169
-
170
-
171
-
172
-
173
-
174
-
175
-
176
-
177
-
178
 |
 |

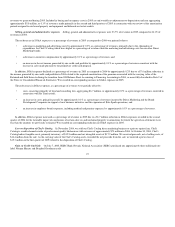
card accounts and related assets, as well as the outstanding balances associated with such accounts (Credit Card Sale). The total purchase price was
approximately $647 million, consisting of approximately $534 million in net cash proceeds and the assumption of approximately $113 million of outstanding
debt under our revolving credit card securitization facility. We recognized a gain of $6.2 million in connection with the sale of our credit card portfolio to
HSBC. Our proprietary credit card portfolio generated income, representing primarily the excess of finance charge income, net of credit losses, of
approximately $75.4 million in 2005. If the Credit Card Sale had been consummated as of the first day of 2005, we believe, the HSBC Program Income for
2005 would have been at least $42 million. HSBC and the Company are currently in the process of implementing changes to the proprietary credit card
program that we expect will be fully implemented during the fourth quarter of 2006. Had such changes been fully implemented on the first day of 2005, we
believe the HSBC Program Income for 2005 would have been approximately $56 million. See Note 2 of the Notes to Consolidated Financial Statements for
further discussion.
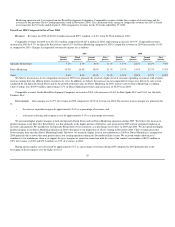
Segment operating earnings. Operating earnings for our Specialty Retail Stores segment were $377.8 million for 2005 compared to $310.6 million for
2004. This 21.6% increase was primarily the result of increased revenues and margins and net decreases in both buying and occupancy expenses and SG&A
expenses as a percentage of revenues.
Operating earnings for Direct Marketing increased to $75.2 million in 2005 from $61.3 million for 2004. This 22.6% increase was primarily the result of
increased revenues and margins and net decreases in both buying and occupancy expenses and SG&A expenses as a percentage of revenues, partly offset by a
higher level of net markdowns.
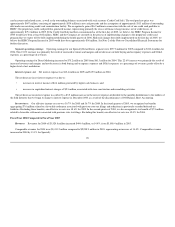
Interest expense, net. Net interest expense was $12.4 million in 2005 and $15.9 million in 2004.
The net decrease in net interest expense was due to:
increases in interest income of $4.4 million generated by higher cash balances; and
increases in capitalized interest charges of $2.3 million associated with store construction and remodeling activities.
The net decrease in interest expense was offset by a $3.5 million increase in the interest expense attributable to the monthly distributions to the holders of
the Sold Interests that we began to charge to interest expense in December 2003 as a result of the discontinuance of Off-Balance Sheet Accounting.
Income taxes. Our effective income tax rate was 36.7% for 2005 and 36.7% for 2004. In the fourth quarter of 2005, we recognized tax benefits
aggregating $7.6 million related to a favorable settlement associated with previous state tax filings and reductions in previously recorded deferred tax
liabilities. Excluding these benefits, our effective tax rate was 38.6% for 2005. In the second quarter of 2004, we also recognized a tax benefit of $7.5 million
related to favorable settlements associated with previous state tax filings. Excluding this benefit, our effective tax rate was 39.0% for 2004.
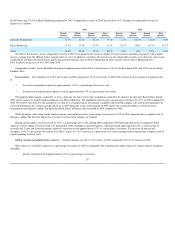
Fiscal Year 2004 Compared to Fiscal Year 2003
Revenues. Revenues for 2004 of $3,524.8 million increased $444.4 million, or 14.4%, from $3,080.4 million in 2003.
Comparable revenues for 2004 were $3,431.2 million compared to $2,998.9 million in 2003, representing an increase of 14.4%. Comparable revenues
increased in 2004 by 13.1% for Specialty
28
•
•