Neiman Marcus 2004 Annual Report Download - page 94
Download and view the complete annual report
Please find page 94 of the 2004 Neiman Marcus annual report below. You can navigate through the pages in the report by either clicking on the pages listed below, or by using the keyword search tool below to find specific information within the annual report.-
 1
1 -
2
-
3
-
4
-
5
-
6
-
7
-
8
-
9
-
10
-
11
-
12
-
13
-
14
-
15
-
16
-
17
-
18
-
19
-
20
-
21
-
22
-
23
-
24
-
25
-
26
-
27
-
28
-
29
-
30
-
31
-
32
-
33
-
34
-
35
-
36
-
37
-
38
-
39
-
40
-
41
-
42
-
43
-
44
-
45
-
46
-
47
-
48
-
49
-
50
-
51
-
52
-
53
-
54
-
55
-
56
-
57
-
58
-
59
-
60
-
61
-
62
-
63
-
64
-
65
-
66
-
67
-
68
-
69
-
70
-
71
-
72
-
73
-
74
-
75
-
76
-
77
-
78
-
79
-
80
-
81
-
82
-
83
-
 84
84 -
 85
85 -
 86
86 -
 87
87 -
 88
88 -
 89
89 -
 90
90 -
 91
91 -
 92
92 -
 93
93 -
 94
94 -
 95
95 -
 96
96 -
 97
97 -
 98
98 -
 99
99 -
 100
100 -
 101
101 -
 102
102 -
 103
103 -
 104
104 -
105
-
106
-
107
-
108
-
109
-
110
-
111
-
112
-
113
-
114
-
115
-
116
-
117
-
118
-
119
-
120
-
121
-
122
-
123
-
124
-
125
-
126
-
127
-
128
-
129
-
130
-
131
-
132
-
133
-
134
-
135
-
136
-
137
-
138
-
139
-
140
-
141
-
142
-
143
-
144
-
145
-
146
-
147
-
148
-
149
-
150
-
151
-
152
-
153
-
154
-
155
-
156
-
157
-
158
-
159
-
160
-
161
-
162
-
163
-
164
-
165
-
166
-
167
-
168
-
169
-
170
-
171
-
172
-
173
-
174
-
175
-
176
-
177
-
178
 |
 |

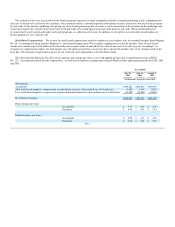
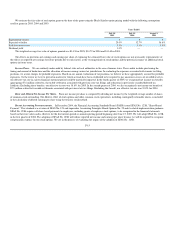
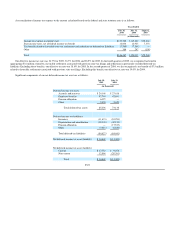
We estimate the fair value of each option grant on the date of the grant using the Black-Scholes option pricing model with the following assumptions
used for grants in 2005, 2004 and 2003:
Years Ended
July 30,
2005
July 31,
2004
August 2,
2003
Expected life (years) 5 5 5
Expected volatility 25.0% 32.7% 36.6%
Risk-free interest rate 3.3% 3.1% 3.0%
Dividend yield 1.0% — —
The weighted-average fair value of options granted was $14.38 in 2005, $14.79 in 2004 and $11.40 in 2003.
The effects on pro forma net earnings and earnings per share of expensing the estimated fair value of stock options are not necessarily representative of
the effects on reported net earnings for future periods due to such factors as the vesting periods of stock options and the potential issuance of additional stock
options in future years.
Income Taxes. We are routinely under audit by federal, state or local authorities in the area of income taxes. These audits include questioning the
timing and amount of deductions and the allocation of income among various tax jurisdictions. In evaluating the exposure associated with various tax filing
positions, we accrue charges for probable exposures. Based on our annual evaluations of tax positions, we believe we have appropriately accrued for probable
exposures. To the extent we were to prevail in matters for which accruals have been established or be required to pay amounts in excess of recorded reserves,
our effective tax rate in a given financial statement period could be materially impacted. In the fourth quarter of 2005, we recognized net income tax benefits
aggregating $7.6 million related to a favorable settlement associated with previous state tax filings and reductions in previously recorded deferred tax
liabilities. Excluding these benefits, our effective tax rate was 38.6% for 2005. In the second quarter of 2004, we also recognized a net income tax benefit of
$7.5 million related to favorable settlements associated with previous state tax filings. Excluding this benefit, our effective tax rate was 39.0% for 2004.
Basic and Diluted Net Income Per Share. Basic net income per share is computed by dividing net income by the weighted average number of shares
of common stock outstanding. The dilutive effect of stock options and other common stock equivalents, including contingently returnable shares, is included
in the calculation of diluted earnings per share using the treasury stock method.
Recent Accounting Pronouncements. In December 2004, the Financial Accounting Standards Board (FASB) issued SFAS No. 123R, "Share-Based
Payment." This standard is a revision of SFAS No. 123 and supersedes Accounting Principles Board Opinion No. 25 and its related implementation guidance.
SFAS No. 123R requires all share-based payments to employees, including grants of employee stock options, to be recognized in the financial statements
based on their fair values and is effective for the first interim period or annual reporting period beginning after June 15, 2005. We will adopt SFAS No. 123R
in the first quarter of 2006. The adoption of SFAS No. 123R will reduce reported net income and earnings per share because we will be required to recognize
compensation expense for our stock options. We are in the process of evaluating the impact of the adoption of SFAS No. 123R.
F-15