Neiman Marcus 2004 Annual Report Download - page 116
Download and view the complete annual report
Please find page 116 of the 2004 Neiman Marcus annual report below. You can navigate through the pages in the report by either clicking on the pages listed below, or by using the keyword search tool below to find specific information within the annual report.-
 1
1 -
2
-
3
-
4
-
5
-
6
-
7
-
8
-
9
-
10
-
11
-
12
-
13
-
14
-
15
-
16
-
17
-
18
-
19
-
20
-
21
-
22
-
23
-
24
-
25
-
26
-
27
-
28
-
29
-
30
-
31
-
32
-
33
-
34
-
35
-
36
-
37
-
38
-
39
-
40
-
41
-
42
-
43
-
44
-
45
-
46
-
47
-
48
-
49
-
50
-
51
-
52
-
53
-
54
-
55
-
56
-
57
-
58
-
59
-
60
-
61
-
62
-
63
-
64
-
65
-
66
-
67
-
68
-
69
-
70
-
71
-
72
-
73
-
74
-
75
-
76
-
77
-
78
-
79
-
80
-
81
-
82
-
83
-
84
-
85
-
86
-
87
-
88
-
89
-
90
-
91
-
92
-
93
-
94
-
95
-
96
-
97
-
98
-
99
-
100
-
101
-
102
-
103
-
104
-
105
-
 106
106 -
 107
107 -
 108
108 -
 109
109 -
 110
110 -
 111
111 -
 112
112 -
 113
113 -
 114
114 -
 115
115 -
 116
116 -
 117
117 -
 118
118 -
 119
119 -
 120
120 -
 121
121 -
 122
122 -
 123
123 -
 124
124 -
 125
125 -
 126
126 -
127
-
128
-
129
-
130
-
131
-
132
-
133
-
134
-
135
-
136
-
137
-
138
-
139
-
140
-
141
-
142
-
143
-
144
-
145
-
146
-
147
-
148
-
149
-
150
-
151
-
152
-
153
-
154
-
155
-
156
-
157
-
158
-
159
-
160
-
161
-
162
-
163
-
164
-
165
-
166
-
167
-
168
-
169
-
170
-
171
-
172
-
173
-
174
-
175
-
176
-
177
-
178
 |
 |

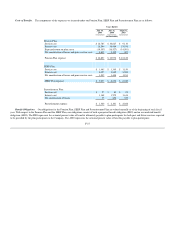
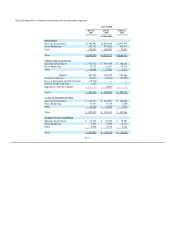
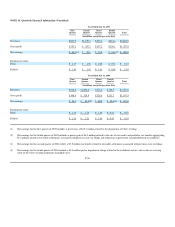
The following tables set forth the information for our reportable segments:
Years Ended
July 30,
2005
July 31,
2004
August 2,
2003
(in thousands)
REVENUES
Specialty Retail Stores $3,102,952 $2,850,088 $2,507,045
Direct Marketing 592,122 570,626 493,473
Other 126,850 104,057 79,835
Total $3,821,924 $3,524,771 $3,080,353
OPERATING EARNINGS
Specialty Retail Stores $ 377,772 $ 310,579 $ 198,201
Direct Marketing 75,178 61,307 45,754
Other 14,088 12,989 9,011
Subtotal 467,038 384,875 252,966
Corporate expenses (46,334) (35,786) (30,856)
Loss on disposition of Chef's Catalog (15,348) — —
Gain on Credit Card Sale 6,170 — —
Impairment and other charges — (3,853) —
Total $ 411,526 $ 345,236 $ 222,110
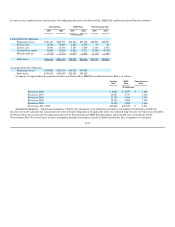
CAPITAL EXPENDITURES
Specialty Retail Stores $ 176,519 $ 101,101 $ 120,867
Direct Marketing 13,736 13,319 6,761
Other 12,280 6,053 1,940
Total $ 202,535 $ 120,473 $ 129,568
DEPRECIATION EXPENSE
Specialty Retail Stores $ 94,386 $ 88,265 $ 72,055
Direct Marketing 9,203 8,058 8,692
Other 4,098 2,719 2,131
Total $ 107,687 $ 99,042 $ 82,878
F-37