Neiman Marcus 2004 Annual Report Download - page 27
Download and view the complete annual report
Please find page 27 of the 2004 Neiman Marcus annual report below. You can navigate through the pages in the report by either clicking on the pages listed below, or by using the keyword search tool below to find specific information within the annual report.-
 1
1 -
 2
2 -
 3
3 -
 4
4 -
 5
5 -
 6
6 -
 7
7 -
 8
8 -
 9
9 -
 10
10 -
 11
11 -
 12
12 -
 13
13 -
 14
14 -
 15
15 -
 16
16 -
 17
17 -
 18
18 -
 19
19 -
 20
20 -
 21
21 -
 22
22 -
 23
23 -
 24
24 -
 25
25 -
 26
26 -
 27
27 -
 28
28 -
 29
29 -
 30
30 -
 31
31 -
 32
32 -
 33
33 -
 34
34 -
 35
35 -
 36
36 -
 37
37 -
 38
38 -
 39
39 -
 40
40 -
 41
41 -
 42
42 -
 43
43 -
 44
44 -
 45
45 -
 46
46 -
 47
47 -
 48
48 -
 49
49 -
 50
50 -
 51
51 -
 52
52 -
 53
53 -
 54
54 -
 55
55 -
 56
56 -
 57
57 -
 58
58 -
 59
59 -
 60
60 -
 61
61 -
 62
62 -
 63
63 -
 64
64 -
 65
65 -
 66
66 -
 67
67 -
 68
68 -
 69
69 -
 70
70 -
 71
71 -
 72
72 -
 73
73 -
 74
74 -
 75
75 -
 76
76 -
 77
77 -
 78
78 -
 79
79 -
 80
80 -
 81
81 -
 82
82 -
 83
83 -
 84
84 -
 85
85 -
 86
86 -
 87
87 -
 88
88 -
 89
89 -
 90
90 -
 91
91 -
 92
92 -
 93
93 -
 94
94 -
 95
95 -
 96
96 -
 97
97 -
 98
98 -
 99
99 -
 100
100 -
 101
101 -
 102
102 -
 103
103 -
 104
104 -
 105
105 -
 106
106 -
 107
107 -
 108
108 -
 109
109 -
 110
110 -
 111
111 -
 112
112 -
 113
113 -
 114
114 -
 115
115 -
 116
116 -
 117
117 -
 118
118 -
 119
119 -
 120
120 -
 121
121 -
 122
122 -
 123
123 -
 124
124 -
 125
125 -
 126
126 -
 127
127 -
 128
128 -
 129
129 -
 130
130 -
 131
131 -
 132
132 -
 133
133 -
 134
134 -
 135
135 -
 136
136 -
 137
137 -
 138
138 -
 139
139 -
 140
140 -
 141
141 -
 142
142 -
 143
143 -
 144
144 -
 145
145 -
 146
146 -
 147
147 -
 148
148 -
 149
149 -
 150
150 -
 151
151 -
 152
152 -
 153
153 -
 154
154 -
 155
155 -
 156
156 -
 157
157 -
 158
158 -
 159
159 -
 160
160 -
 161
161 -
 162
162 -
 163
163 -
 164
164 -
 165
165 -
 166
166 -
 167
167 -
 168
168 -
 169
169 -
 170
170 -
 171
171 -
 172
172 -
 173
173 -
 174
174 -
 175
175 -
 176
176 -
 177
177 -
 178
178
 |
 |

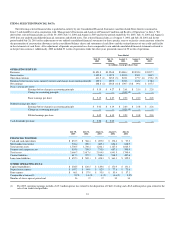
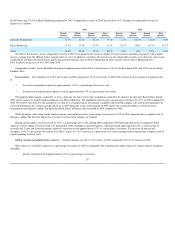
The following table sets forth certain financial measures on a quarterly basis for 2005:
First
Quarter
Second
Quarter
Third
Quarter
Fourth
Quarter
Revenues as a percentage of annual revenues 23.8% 29.5% 24.4% 22.3%
Gross margin 38.9% 32.5% 38.3% 29.4%
Selling, general and administrative expenses as a percentage of revenues 25.1% 21.9% 23.8% 24.5%
Operating margin 12.1% 10.6% 14.4% 5.6%
See Note 15 of the Notes to Consolidated Financial Statements for additional information about our quarterly operating results.
OPERATING RESULTS
Performance Summary
The following table sets forth certain items expressed as percentages of revenues for the periods indicated.
Years Ended
July 30,
2005
July 31,
2004
August 2,
2003
Revenues 100.0% 100.0% 100.0%
Cost of goods sold including buying and occupancy costs 65.3 66.0 67.5
Selling, general and administrative expenses 23.7 24.1 25.3
Loss on disposition of Chef's Catalog 0.4 — —
Gain on Credit Card Sale (0.2) — —
Impairment and other charges — 0.1 —
Operating earnings 10.8 9.8 7.2
Interest expense, net 0.3 0.5 0.5
Earnings before income taxes, minority interest and change in accounting principle 10.5 9.3 6.7
Income taxes 3.8 3.4 2.6
Earnings before minority interest and change in accounting principle 6.7 5.9 4.1
Minority interest in net earnings of subsidiaries (0.1) (0.1) (0.1)
Earnings before change in accounting principle 6.6 5.8 4.0
Change in accounting principle — — (0.5)
Net earnings 6.6% 5.8% 3.5%
24
