Neiman Marcus 2004 Annual Report Download - page 19
Download and view the complete annual report
Please find page 19 of the 2004 Neiman Marcus annual report below. You can navigate through the pages in the report by either clicking on the pages listed below, or by using the keyword search tool below to find specific information within the annual report.-
 1
1 -
2
-
3
-
4
-
5
-
6
-
7
-
8
-
 9
9 -
 10
10 -
 11
11 -
 12
12 -
 13
13 -
 14
14 -
 15
15 -
 16
16 -
 17
17 -
 18
18 -
 19
19 -
 20
20 -
 21
21 -
 22
22 -
 23
23 -
 24
24 -
 25
25 -
 26
26 -
 27
27 -
 28
28 -
 29
29 -
30
-
31
-
32
-
33
-
34
-
35
-
36
-
37
-
38
-
39
-
40
-
41
-
42
-
43
-
44
-
45
-
46
-
47
-
48
-
49
-
50
-
51
-
52
-
53
-
54
-
55
-
56
-
57
-
58
-
59
-
60
-
61
-
62
-
63
-
64
-
65
-
66
-
67
-
68
-
69
-
70
-
71
-
72
-
73
-
74
-
75
-
76
-
77
-
78
-
79
-
80
-
81
-
82
-
83
-
84
-
85
-
86
-
87
-
88
-
89
-
90
-
91
-
92
-
93
-
94
-
95
-
96
-
97
-
98
-
99
-
100
-
101
-
102
-
103
-
104
-
105
-
106
-
107
-
108
-
109
-
110
-
111
-
112
-
113
-
114
-
115
-
116
-
117
-
118
-
119
-
120
-
121
-
122
-
123
-
124
-
125
-
126
-
127
-
128
-
129
-
130
-
131
-
132
-
133
-
134
-
135
-
136
-
137
-
138
-
139
-
140
-
141
-
142
-
143
-
144
-
145
-
146
-
147
-
148
-
149
-
150
-
151
-
152
-
153
-
154
-
155
-
156
-
157
-
158
-
159
-
160
-
161
-
162
-
163
-
164
-
165
-
166
-
167
-
168
-
169
-
170
-
171
-
172
-
173
-
174
-
175
-
176
-
177
-
178
 |
 |

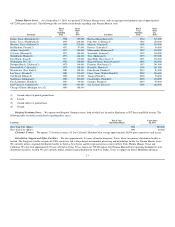
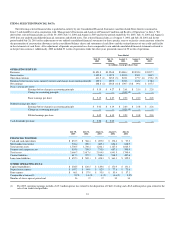
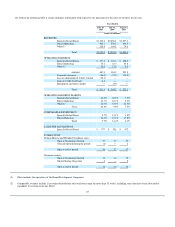
ITEM 6. SELECTED FINANCIAL DATA
The following selected financial data is qualified in entirety by our Consolidated Financial Statements (and the related Notes thereto) contained in
Item 15 and should be read in conjunction with "Management's Discussion and Analysis of Financial Condition and Results of Operations" in Item 7. We
derived the selected financial data as of July 30, 2005, July 31, 2004 and August 2, 2003 and for the periods ended July 30, 2005, July 31, 2004 and August 2,
2003 from our audited consolidated financial statements and related notes. The selected financial data as of August 3, 2002 and July 28, 2001 and for the
period ended July 28, 2001 reflect adjustments to our audited consolidated financial statements for those specific years to reclassify certain amounts related to
the presentation of construction allowances in the consolidated balance sheets and statements of cash flows and the retained interest of our credit card facility
in the statements of cash flows. After adjustment, all periods are presented on a basis comparable to our audited consolidated financial statements referred to
in the previous sentence. Additionally, 2002 included 53 weeks of operations while the other years presented consist of 52 weeks of operations.
Years Ended
July 30,
2005
July 31,
2004
August 2,
2003
August 3,
2002
July 28,
2001
(in millions, except per share data)
OPERATING RESULTS
Revenues $3,821.9 $3,524.8 $3,080.4 $2,932.0 $2,997.7
Gross margin 1,327.8 1,197.5 1,001.9 930.1 969.5
Operating earnings 411.5 (1) 345.2 (3) 222.1 177.7 (6) 193.6 (7)
Earnings before income taxes, minority interest and change in accounting principle 399.1 329.3 205.8 162.2 178.4
Net earnings 248.8 (2) 204.8 (4) $ 109.3 (5) $ 99.6 $ 107.5
Basic earnings per share:
Earnings before change in accounting principle $ 5.15 $ 4.27 $ 2.61 $ 2.10 $ 2.28
Change in accounting principle — — (0.31)(5) — —
Basic earnings per share $ 5.15 $ 4.27 $ 2.30 $ 2.10 $ 2.28
Diluted earnings per share:
Earnings before change in accounting principle $ 5.02 $ 4.19 $ 2.60 $ 2.08 $ 2.26
Change in accounting principle — — (0.31)(5) — —
Diluted earnings per share $ 5.02 $ 4.19 $ 2.29 $ 2.08 $ 2.26
Cash dividends per share $ 0.58 $ 0.39 — — —
July 30,
2005
July 31,
2004
August 2,
2003
August 3,
2002
July 28,
2001
FINANCIAL POSITION
Cash and cash equivalents $ 853.5 $ 368.4 $ 207.0 $ 178.6 $ 97.3
Merchandise inventories 748.4 720.3 687.1 656.8 648.9
Total current assets 1,708.5 1,706.2 1,246.1 1,127.6 1,063.3
Property and equipment, net 855.0 750.5 733.8 687.1 598.9
Total assets 2,660.7 2,617.6 2,104.8 1,941.5 1,799.9
Current liabilities 617.3 727.7 530.4 518.5 497.6
Long-term liabilities $ 457.3 $ 509.1 $ 428.3 $ 361.1 $ 352.9
OTHER OPERATING DATA:
Capital expenditures $ 202.5 $ 120.5 $ 129.6 $ 171.9 $ 131.1
Depreciation expense $ 107.7 $ 99.0 $ 82.9 $ 77.8 $ 73.6
Rent expense $ 66.1 $ 57.9 $ 53.8 $ 53.4 $ 57.1
Comparable revenues(8) 9.9% 14.4% 4.1% (4.6)% 2.2%
Number of stores open at period end 36 37 37 35 34
For 2005, operating earnings include a $15.3 million pretax loss related to the disposition of Chef's Catalog and a $6.2 million pretax gain related to the
sale of our credit card portfolio.
16
(1)