Neiman Marcus 2004 Annual Report Download - page 66
Download and view the complete annual report
Please find page 66 of the 2004 Neiman Marcus annual report below. You can navigate through the pages in the report by either clicking on the pages listed below, or by using the keyword search tool below to find specific information within the annual report.-
 1
1 -
2
-
3
-
4
-
5
-
6
-
7
-
8
-
9
-
10
-
11
-
12
-
13
-
14
-
15
-
16
-
17
-
18
-
19
-
20
-
21
-
22
-
23
-
24
-
25
-
26
-
27
-
28
-
29
-
30
-
31
-
32
-
33
-
34
-
35
-
36
-
37
-
38
-
39
-
40
-
41
-
42
-
43
-
44
-
45
-
46
-
47
-
48
-
49
-
50
-
51
-
52
-
53
-
54
-
55
-
 56
56 -
 57
57 -
 58
58 -
 59
59 -
 60
60 -
 61
61 -
 62
62 -
 63
63 -
 64
64 -
 65
65 -
 66
66 -
 67
67 -
 68
68 -
 69
69 -
 70
70 -
 71
71 -
 72
72 -
 73
73 -
 74
74 -
 75
75 -
 76
76 -
77
-
78
-
79
-
80
-
81
-
82
-
83
-
84
-
85
-
86
-
87
-
88
-
89
-
90
-
91
-
92
-
93
-
94
-
95
-
96
-
97
-
98
-
99
-
100
-
101
-
102
-
103
-
104
-
105
-
106
-
107
-
108
-
109
-
110
-
111
-
112
-
113
-
114
-
115
-
116
-
117
-
118
-
119
-
120
-
121
-
122
-
123
-
124
-
125
-
126
-
127
-
128
-
129
-
130
-
131
-
132
-
133
-
134
-
135
-
136
-
137
-
138
-
139
-
140
-
141
-
142
-
143
-
144
-
145
-
146
-
147
-
148
-
149
-
150
-
151
-
152
-
153
-
154
-
155
-
156
-
157
-
158
-
159
-
160
-
161
-
162
-
163
-
164
-
165
-
166
-
167
-
168
-
169
-
170
-
171
-
172
-
173
-
174
-
175
-
176
-
177
-
178
 |
 |

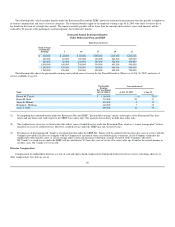
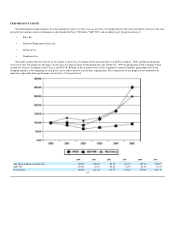
PERFORMANCE GRAPH
The following line graph compares the total cumulative return over five years on our Class A Common Stock to the total cumulative return over the same
period of the common stocks of companies in the Standard & Poor's 500 Index ("S&P 500") and an industry peer group consisting of:
Saks, Inc.
Federated Department Stores, Inc.
Tiffany & Co.
Nordstrom, Inc.
The graph assumes that the value of an investment in our Class A Common Stock and each index was $100 at August 1, 2000, and that all dividends
were reinvested. The graph uses the prices of our Class A Common Stock for the period since the October 22, 1999 recapitalization of the Company which
created two classes of common stock, Class A and Class B. Returns on the common stocks of the companies in the peer industry group index have been
weighted annually at the beginning of each fiscal year to reflect relative stock market capitalization. The comparisons in this graph are not intended to be
indicative of possible future performance of our Class A Common Stock.
2000 2001 2002 2003 2004 2005
The Neiman Marcus Group, Inc. 100.00 100.07 85.77 119.13 165.34 300.77
S&P 500 100.00 85.67 65.43 72.39 81.92 93.43
Peer Group 100.00 129.32 112.73 130.41 170.26 251.39
63
•
•
•
•