Kodak 2009 Annual Report Download - page 99
Download and view the complete annual report
Please find page 99 of the 2009 Kodak annual report below. You can navigate through the pages in the report by either clicking on the pages listed below, or by using the keyword search tool below to find specific information within the annual report.-
 1
1 -
2
-
3
-
4
-
5
-
6
-
7
-
8
-
9
-
10
-
11
-
12
-
13
-
14
-
15
-
16
-
17
-
18
-
19
-
20
-
21
-
22
-
23
-
24
-
25
-
26
-
27
-
28
-
29
-
30
-
31
-
32
-
33
-
34
-
35
-
36
-
37
-
38
-
39
-
40
-
41
-
42
-
43
-
44
-
45
-
46
-
47
-
48
-
49
-
50
-
51
-
52
-
53
-
54
-
55
-
56
-
57
-
58
-
59
-
60
-
61
-
62
-
63
-
64
-
65
-
66
-
67
-
68
-
69
-
70
-
71
-
72
-
73
-
74
-
75
-
76
-
77
-
78
-
79
-
80
-
81
-
82
-
83
-
84
-
85
-
86
-
87
-
88
-
 89
89 -
 90
90 -
 91
91 -
 92
92 -
 93
93 -
 94
94 -
 95
95 -
 96
96 -
 97
97 -
 98
98 -
 99
99 -
 100
100 -
 101
101 -
 102
102 -
 103
103 -
 104
104 -
 105
105 -
 106
106 -
 107
107 -
 108
108 -
 109
109 -
110
-
111
-
112
-
113
-
114
-
115
-
116
-
117
-
118
-
119
-
120
-
121
-
122
-
123
-
124
-
125
-
126
-
127
-
128
-
129
-
130
-
131
-
132
-
133
-
134
-
135
-
136
-
137
-
138
-
139
-
140
-
141
-
142
-
143
-
144
-
145
-
146
-
147
-
148
-
149
-
150
-
151
-
152
-
153
-
154
-
155
-
156
-
157
-
158
-
159
-
160
-
161
-
162
-
163
-
164
-
165
-
166
-
167
-
168
-
169
-
170
-
171
-
172
-
173
-
174
-
175
-
176
-
177
-
178
-
179
-
180
-
181
-
182
-
183
-
184
-
185
-
186
-
187
-
188
-
189
-
190
-
191
-
192
-
193
-
194
-
195
-
196
-
197
-
198
-
199
-
200
-
201
-
202
-
203
-
204
-
205
-
206
-
207
-
208
-
209
-
210
-
211
-
212
-
213
-
214
-
215
-
216
-
217
-
218
-
219
-
220
-
221
-
222
-
223
-
224
-
225
-
226
-
227
-
228
-
229
-
230
-
231
-
232
-
233
-
234
-
235
-
236
-
237
-
238
-
239
-
240
-
241
-
242
-
243
-
244
-
245
-
246
-
247
-
248
-
249
-
250
-
251
-
252
-
253
-
254
-
255
-
256
-
257
-
258
-
259
-
260
-
261
-
262
-
263
-
264
 |
 |

97
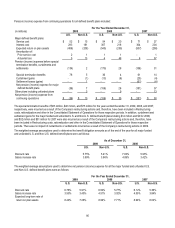
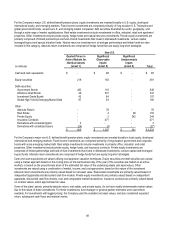
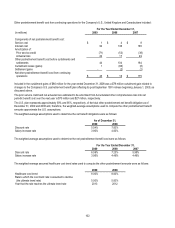
The Company's weighted-average asset allocations for its major non-U.S. defined benefit pension plans, by asset category are as
follows:
As of December 31,
Asset Category 2009 2008 2009 Target
Equity securities 15% 18% 12%-18%
Debt securities 47% 30% 44%-50%
Real estate 4% 5% 3%-9%
Cash 4% 9% 0%-5%
Other 30% 38% 27%-37%
Total 100% 100%
The Other asset category in the tables above is primarily composed of private equity, venture capital, and other investments.
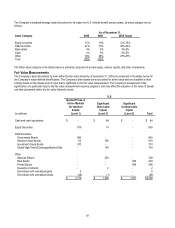
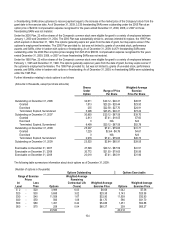
Fair Value Measurements
The Company’s asset allocations by level within the fair value hierarchy at December 31, 2009 are presented in the tables below for
the Company’s major defined benefit plans. The Company’s plan assets were accounted for at fair value and are classified in their
entirety based on the lowest level of input that is significant to the fair value measurement. The Company’s assessment of the
significance of a particular input to the fair value measurement requires judgment, and may affect the valuation of fair value of assets
and their placement within the fair value hierarchy levels.
U.S.
(in millions)
Quoted Prices in
Active Markets
for Identical
Assets
(Level 1)
Significant
Observable
Inputs
(Level 2)
Significant
Unobservable
Inputs
(Level 3) Total
Cash and cash equivalents $ - $ 84 $ - $ 84
Equity Securities 979 14 - 993
Debt Securities:
Government Bonds 800 - - 800
Inflation-Linked Bonds 63 756 - 819
Investment Grade Bonds 370 - - 370
Global High Yield & Emerging Market Debt - 144 - 144
Other:
Absolute Return - 329 - 329
Real Estate - - 293 293
Private Equity - - 958 958
Insurance Contracts - 2 - 2
Derivatives with unrealized gains 5 - - 5
Derivatives with unrealized losses (38) (1) - (39)
$ 2,179 $ 1,328 $ 1,251 $ 4,758