Kodak 2009 Annual Report Download - page 189
Download and view the complete annual report
Please find page 189 of the 2009 Kodak annual report below. You can navigate through the pages in the report by either clicking on the pages listed below, or by using the keyword search tool below to find specific information within the annual report.-
 1
1 -
2
-
3
-
4
-
5
-
6
-
7
-
8
-
9
-
10
-
11
-
12
-
13
-
14
-
15
-
16
-
17
-
18
-
19
-
20
-
21
-
22
-
23
-
24
-
25
-
26
-
27
-
28
-
29
-
30
-
31
-
32
-
33
-
34
-
35
-
36
-
37
-
38
-
39
-
40
-
41
-
42
-
43
-
44
-
45
-
46
-
47
-
48
-
49
-
50
-
51
-
52
-
53
-
54
-
55
-
56
-
57
-
58
-
59
-
60
-
61
-
62
-
63
-
64
-
65
-
66
-
67
-
68
-
69
-
70
-
71
-
72
-
73
-
74
-
75
-
76
-
77
-
78
-
79
-
80
-
81
-
82
-
83
-
84
-
85
-
86
-
87
-
88
-
89
-
90
-
91
-
92
-
93
-
94
-
95
-
96
-
97
-
98
-
99
-
100
-
101
-
102
-
103
-
104
-
105
-
106
-
107
-
108
-
109
-
110
-
111
-
112
-
113
-
114
-
115
-
116
-
117
-
118
-
119
-
120
-
121
-
122
-
123
-
124
-
125
-
126
-
127
-
128
-
129
-
130
-
131
-
132
-
133
-
134
-
135
-
136
-
137
-
138
-
139
-
140
-
141
-
142
-
143
-
144
-
145
-
146
-
147
-
148
-
149
-
150
-
151
-
152
-
153
-
154
-
155
-
156
-
157
-
158
-
159
-
160
-
161
-
162
-
163
-
164
-
165
-
166
-
167
-
168
-
169
-
170
-
171
-
172
-
173
-
174
-
175
-
176
-
177
-
178
-
 179
179 -
 180
180 -
 181
181 -
 182
182 -
 183
183 -
 184
184 -
 185
185 -
 186
186 -
 187
187 -
 188
188 -
 189
189 -
 190
190 -
 191
191 -
 192
192 -
 193
193 -
 194
194 -
 195
195 -
 196
196 -
 197
197 -
 198
198 -
 199
199 -
200
-
201
-
202
-
203
-
204
-
205
-
206
-
207
-
208
-
209
-
210
-
211
-
212
-
213
-
214
-
215
-
216
-
217
-
218
-
219
-
220
-
221
-
222
-
223
-
224
-
225
-
226
-
227
-
228
-
229
-
230
-
231
-
232
-
233
-
234
-
235
-
236
-
237
-
238
-
239
-
240
-
241
-
242
-
243
-
244
-
245
-
246
-
247
-
248
-
249
-
250
-
251
-
252
-
253
-
254
-
255
-
256
-
257
-
258
-
259
-
260
-
261
-
262
-
263
-
264
 |
 |

45
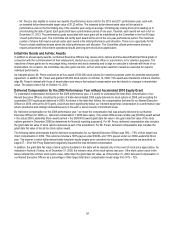
As described further in the section on Elements of Total Direct Compensation beginning on page 46 of this Proxy Statement, the
Committee did not rely on market data in 2009 but, rather, focused on the need to manage costs in its base salary and target variable
opportunity decisions. In making dollar-denominated equity decisions, the Committee primarily focused on the retentive value of unvested
equity holdings and shareholder alignment objectives, as well as grant guidelines set for each executive in prior years.
In approaching 2009 compensation decisions, management gathered and analyzed data and provided a recommendation, with supporting
rationale, for dialog with the Committee. Management provided a recommendation for each Named Executive Officer, with the exception of
our CEO. In the case of our CEO, the independent consultant gathered and analyzed data and discussed a recommendation with the
Committee Chair. The Committee took these recommendations into consideration and exercised its judgment in making decisions. For
additional information regarding the role of the independent consultant, see pages 27 – 28 of this Proxy Statement.
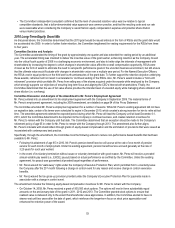
Factors Considered by the Committee to Determine Level and Mix of Target Total Direct Compensation
The Committee considers a broad range of facts and circumstances when determining levels of executive compensation, including: 1)
market competitiveness; 2) experience relative to typical market peers; 3) the importance of the position in the Company relative to other
senior management positions; 4) sustained individual performance; 5) readiness for promotion to a higher level and/or role in the
Company’s senior management succession plans; and 6) retention of critical talent. The significance of any individual factor will vary from
year-to-year and may vary among Named Executive Officers.
The Committee does not have a pre-defined target for each element of total direct compensation as a portion of the whole. In approaching
specific salary, target annual incentive and equity decisions for 2009, the Committee determined it would hold target total direct
compensation levels at 2008 levels. The Committee decided to maintain the 2008 target mix of total direct compensation for our Named
Executive Officers because, in the Committee’s view, it resulted in a well balanced mix of fixed versus variable pay and cash versus equity
compensation. Decisions for each element of total direct compensation are described more fully below in the section on Elements of Total
Direct Compensation.
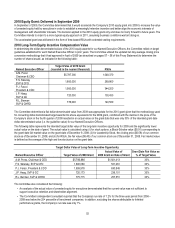
In general, the Committee does not consider awards granted or earned under plans in past years when setting annual target total direct
compensation levels of our Named Executive Officers. The Committee does, however, consider equity awards granted in past years in the
evaluation of the retentive value of the Company’s long-term equity incentive plans and the timing, mix and vesting of long-term equity
incentives as further described beginning on page 50 of this Proxy Statement.
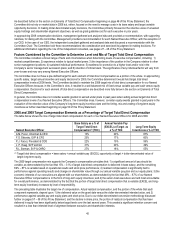
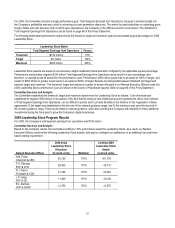
2008 and 2009 Target Compensation Elements as a Percentage of Target Total Direct Compensation
The table below shows the mix of target total direct compensation for each of our Named Executive Officers for 2008 and 2009.
(1) Target total direct compensation = base salary + annual variable pay (EXCEL) opportunity at target + dollar-denominated value of
target long-term equity.
The 2009 target compensation mix supports the Company’s compensation principles that: 1) a significant amount of pay should be
variable, as demonstrated by the fact that 13% – 31% of target total direct compensation is delivered in base salary, and the remaining
69% – 87% is variable based on operational results and stock price performance; 2) realized compensation is significantly tied to
performance against operating results and changes in shareholder value through our annual variable pay plan and our equity plans; 3) the
economic interests of our executives are aligned with our shareholders, as demonstrated by the fact that 49% – 67% of our Named
Executive Officer compensation is in the form of long-term equity incentives; and 4) the senior-most executives are held most accountable
for overall performance, as demonstrated by the fact that the portion of target total direct compensation that is variable (EXCEL and long-
term equity incentives) increases by level of responsibility.
The preceding table illustrates the target mix of compensation. Actual realized compensation, and the portion of the whole that each
component represents, depend upon: 1) the delivered value on the grant date versus the dollar-denominated intended value, and 2)
performance against variable pay and equity plans and stock price. Due to our dollar-denominated conversion methodology discussed
further on pages 57 – 58 of this Proxy Statement, and the decline in share price, the portion of realized compensation that has been
delivered in equity has been significantly below target levels over the last several years. This created a significant retention concern and
resulted in a less than intended level of alignment between executive and shareholder interests.
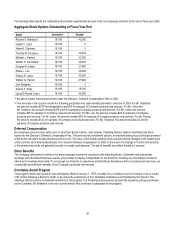
Named Executive Officer
Base Salary as a % of
Target Total Direct
Compensation(1) (TDC)
Annual Variable Pay
(EXCEL) at Target as
a % of TDC
Long-Term Equity
Incentive as a % of TDC
A.M. Perez, Chairman & CEO
13%
20%
67%
F.S. Sklarsky, EVP & CFO
23%
17%
60%
P.J. Faraci, President & COO
22%
19%
59%
J. P. Haag, SVP and GC
31%
20%
49%
R.L. Berman, SVP & CHRO
27%
18%
55%