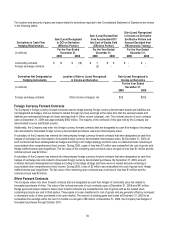
Kodak 2009 Annual Report Download - page 96
Download and view the complete annual report
Please find page 96 of the 2009 Kodak annual report below. You can navigate through the pages in the report by either clicking on the pages listed below, or by using the keyword search tool below to find specific information within the annual report.-
 1
1 -
2
-
3
-
4
-
5
-
6
-
7
-
8
-
9
-
10
-
11
-
12
-
13
-
14
-
15
-
16
-
17
-
18
-
19
-
20
-
21
-
22
-
23
-
24
-
25
-
26
-
27
-
28
-
29
-
30
-
31
-
32
-
33
-
34
-
35
-
36
-
37
-
38
-
39
-
40
-
41
-
42
-
43
-
44
-
45
-
46
-
47
-
48
-
49
-
50
-
51
-
52
-
53
-
54
-
55
-
56
-
57
-
58
-
59
-
60
-
61
-
62
-
63
-
64
-
65
-
66
-
67
-
68
-
69
-
70
-
71
-
72
-
73
-
74
-
75
-
76
-
77
-
78
-
79
-
80
-
81
-
82
-
83
-
84
-
85
-
 86
86 -
 87
87 -
 88
88 -
 89
89 -
 90
90 -
 91
91 -
 92
92 -
 93
93 -
 94
94 -
 95
95 -
 96
96 -
 97
97 -
 98
98 -
 99
99 -
 100
100 -
 101
101 -
 102
102 -
 103
103 -
 104
104 -
 105
105 -
 106
106 -
107
-
108
-
109
-
110
-
111
-
112
-
113
-
114
-
115
-
116
-
117
-
118
-
119
-
120
-
121
-
122
-
123
-
124
-
125
-
126
-
127
-
128
-
129
-
130
-
131
-
132
-
133
-
134
-
135
-
136
-
137
-
138
-
139
-
140
-
141
-
142
-
143
-
144
-
145
-
146
-
147
-
148
-
149
-
150
-
151
-
152
-
153
-
154
-
155
-
156
-
157
-
158
-
159
-
160
-
161
-
162
-
163
-
164
-
165
-
166
-
167
-
168
-
169
-
170
-
171
-
172
-
173
-
174
-
175
-
176
-
177
-
178
-
179
-
180
-
181
-
182
-
183
-
184
-
185
-
186
-
187
-
188
-
189
-
190
-
191
-
192
-
193
-
194
-
195
-
196
-
197
-
198
-
199
-
200
-
201
-
202
-
203
-
204
-
205
-
206
-
207
-
208
-
209
-
210
-
211
-
212
-
213
-
214
-
215
-
216
-
217
-
218
-
219
-
220
-
221
-
222
-
223
-
224
-
225
-
226
-
227
-
228
-
229
-
230
-
231
-
232
-
233
-
234
-
235
-
236
-
237
-
238
-
239
-
240
-
241
-
242
-
243
-
244
-
245
-
246
-
247
-
248
-
249
-
250
-
251
-
252
-
253
-
254
-
255
-
256
-
257
-
258
-
259
-
260
-
261
-
262
-
263
-
264
 |
 |

94
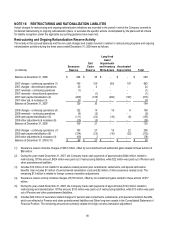
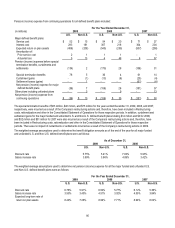
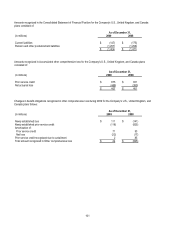
Information with respect to the major funded and unfunded U.S. and Non-U.S. defined benefit plans with an accumulated benefit
obligation in excess of plan assets follows:
As of December 31,
(in millions) 2009 2008
U.S. Non-U.S. U.S. Non-U.S.
Projected benefit obligation $ 351 $ 2,682 $ 343 $ 2,692
Accumulated benefit obligation 349 2,609 331 2,623
Fair value of plan assets 136 1,639 122 1,990
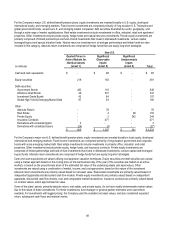
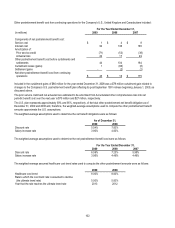
Amounts recognized in Accumulated other comprehensive loss for all major funded and unfunded U.S. and Non-U.S. defined benefit
plans consisted of:
As of December 31,
(in millions) 2009 2008
U.S. Non-U.S. U.S. Non-U.S.
Net transition obligation $ - $ 1 $ - $ 1
Prior service cost (credit) 8 (1) 10 (4)
Net actuarial loss 1,509 1,411 839 918
Total $ 1,517 $ 1,411 $ 849 $ 915
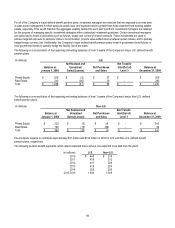
Changes in plan assets and benefit obligations recognized in other comprehensive income (loss) during 2009 for all major funded
and unfunded U.S. and Non-U.S. defined benefit plans follows:
(in millions) 2009 2008
U.S. Non-U.S. U.S. Non-U.S.
Newly established loss $ 695 $ 428 $ 1,810 $ 352
Newly established prior service cost - 2 3 (7)
Amortization of:
Prior service cost (2) (1) (1) (1)
Net actuarial loss (5) (13) (4) (48)
Prior service cost recognized due to curtailment (1) - 1 -
Net curtailment gain not recognized in expense (19) (3) 10 4
Net gain recognized in expense due to settlements - (4) - (8)
Total amount recognized in Other
comprehensive loss $ 668
$ 409 $ 1,819 $ 292
The actuarial loss and prior service cost estimated to be amortized from Accumulated other comprehensive loss into net periodic
pension cost over the next year for all major plans is $39 million and $2 million, respectively.