Kodak 2009 Annual Report Download - page 106
Download and view the complete annual report
Please find page 106 of the 2009 Kodak annual report below. You can navigate through the pages in the report by either clicking on the pages listed below, or by using the keyword search tool below to find specific information within the annual report.-
 1
1 -
2
-
3
-
4
-
5
-
6
-
7
-
8
-
9
-
10
-
11
-
12
-
13
-
14
-
15
-
16
-
17
-
18
-
19
-
20
-
21
-
22
-
23
-
24
-
25
-
26
-
27
-
28
-
29
-
30
-
31
-
32
-
33
-
34
-
35
-
36
-
37
-
38
-
39
-
40
-
41
-
42
-
43
-
44
-
45
-
46
-
47
-
48
-
49
-
50
-
51
-
52
-
53
-
54
-
55
-
56
-
57
-
58
-
59
-
60
-
61
-
62
-
63
-
64
-
65
-
66
-
67
-
68
-
69
-
70
-
71
-
72
-
73
-
74
-
75
-
76
-
77
-
78
-
79
-
80
-
81
-
82
-
83
-
84
-
85
-
86
-
87
-
88
-
89
-
90
-
91
-
92
-
93
-
94
-
95
-
 96
96 -
 97
97 -
 98
98 -
 99
99 -
 100
100 -
 101
101 -
 102
102 -
 103
103 -
 104
104 -
 105
105 -
 106
106 -
 107
107 -
 108
108 -
 109
109 -
 110
110 -
 111
111 -
 112
112 -
 113
113 -
 114
114 -
 115
115 -
 116
116 -
117
-
118
-
119
-
120
-
121
-
122
-
123
-
124
-
125
-
126
-
127
-
128
-
129
-
130
-
131
-
132
-
133
-
134
-
135
-
136
-
137
-
138
-
139
-
140
-
141
-
142
-
143
-
144
-
145
-
146
-
147
-
148
-
149
-
150
-
151
-
152
-
153
-
154
-
155
-
156
-
157
-
158
-
159
-
160
-
161
-
162
-
163
-
164
-
165
-
166
-
167
-
168
-
169
-
170
-
171
-
172
-
173
-
174
-
175
-
176
-
177
-
178
-
179
-
180
-
181
-
182
-
183
-
184
-
185
-
186
-
187
-
188
-
189
-
190
-
191
-
192
-
193
-
194
-
195
-
196
-
197
-
198
-
199
-
200
-
201
-
202
-
203
-
204
-
205
-
206
-
207
-
208
-
209
-
210
-
211
-
212
-
213
-
214
-
215
-
216
-
217
-
218
-
219
-
220
-
221
-
222
-
223
-
224
-
225
-
226
-
227
-
228
-
229
-
230
-
231
-
232
-
233
-
234
-
235
-
236
-
237
-
238
-
239
-
240
-
241
-
242
-
243
-
244
-
245
-
246
-
247
-
248
-
249
-
250
-
251
-
252
-
253
-
254
-
255
-
256
-
257
-
258
-
259
-
260
-
261
-
262
-
263
-
264
 |
 |

104
or freestanding. SARs allow optionees to receive payment equal to the increase in the market price of the Company's stock from the
grant date to the exercise date. As of December 31, 2009, 3,333 freestanding SARs were outstanding under the 2005 Plan at an
option price of $24.59. Compensation expense recognized for the years ended December 31, 2009, 2008, or 2007 on those
freestanding SARs was not material.
Under the 2000 Plan, 22 million shares of the Company's common stock were eligible for grant to a variety of employees between
January 1, 2000 and December 31, 2004. The 2000 Plan was substantially similar to, and was intended to replace, the 1995 Plan,
which expired on December 31, 1999. The options generally expire ten years from the date of grant, but may expire sooner if the
optionee's employment terminates. The 2000 Plan provided for, but was not limited to, grants of unvested stock, performance
awards, and SARs, either in tandem with options or freestanding. As of December 31, 2009, 44,671 freestanding SARs were
outstanding under the 2000 Plan at option prices ranging from $23.25 to $60.50. Compensation expense recognized for the years
ended December 31, 2009, 2008, or 2007 on those freestanding SARs was not material.
Under the 1995 Plan, 22 million shares of the Company’s common stock were eligible for grant to a variety of employees between
February 1, 1995 and December 31, 1999. The options generally expire ten years from the date of grant, but may expire sooner if
the optionee’s employment terminates. The 1995 Plan provided for, but was not limited to, grants of unvested stock, performance
awards, and SARs, either in tandem with options or freestanding. As of December 31, 2009, no freestanding SARs were outstanding
under the 1995 Plan.
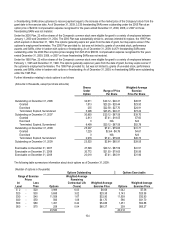
Further information relating to stock options is as follows:
(Amounts in thousands, except per share amounts)
Shares Weighted-Average
Under Range of Price Exercise
Option Per Share Price Per Share
Outstanding on December 31, 2006 34,611 $20.12 - $92.31 $45.57
Granted 1,813 $23.28 - $28.44 $23.50
Exercised 235 $22.58 - $27.70 $24.91
Terminated, Expired, Surrendered 5,296 $23.25 - $92.31 $73.22
Outstanding on December 31, 2007 30,893 $20.12 - $87.59 $39.70
Granted 2,813 $7.41 - $18.55 $7.60
Exercised 0 N/A N/A
Terminated, Expired, Surrendered 8,499 $20.12 - $87.59 $52.78
Outstanding on December 31, 2008 25,207 $7.41 - $79.63 $31.71
Granted 1,229 $2.64 - $6.76 $4.61
Exercised 0 N/A N/A
Terminated, Expired, Surrendered 2,916 $7.41 - $79.63 $45.73
Outstanding on December 31, 2009 23,520 $2.64 - $65.91 $28.55
Exercisable on December 31, 2007 27,546 $20.12 - $87.59 $41.51
Exercisable on December 31, 2008 20,772 $21.93 - $79.63 $35.56
Exercisable on December 31, 2009 20,018 $7.41 - $65.91 $31.96
The following table summarizes information about stock options as of December 31, 2009:
(Number of options in thousands)
Options Outstanding Options Exercisable
Range of Exercise Weighted-Average
Prices Remaining
At Less Contractual Life Weighted-Average Weighted-Average
Least Than Options (Years) Exercise Price Options Exercise Price
$ 2 - $20 3,989 6.03 $6.68 1,042 $7.58
$20 - $30 5,698 3.02 $25.38 5,143 $25.58
$30 - $40 11,558 1.67 $32.90 11,558 $32.90
$40 - $50 566 1.08 $41.70 566 $41.70
$50 - $60 1,451 0.24 $54.86 1,451 $54.86
$60 - $70 258 0.04 $65.27 258 $65.27
23,520 20,018