Kodak 2009 Annual Report Download - page 37
Download and view the complete annual report
Please find page 37 of the 2009 Kodak annual report below. You can navigate through the pages in the report by either clicking on the pages listed below, or by using the keyword search tool below to find specific information within the annual report.-
 1
1 -
2
-
3
-
4
-
5
-
6
-
7
-
8
-
9
-
10
-
11
-
12
-
13
-
14
-
15
-
16
-
17
-
18
-
19
-
20
-
21
-
22
-
23
-
24
-
25
-
26
-
 27
27 -
 28
28 -
 29
29 -
 30
30 -
 31
31 -
 32
32 -
 33
33 -
 34
34 -
 35
35 -
 36
36 -
 37
37 -
 38
38 -
 39
39 -
 40
40 -
 41
41 -
 42
42 -
 43
43 -
 44
44 -
 45
45 -
 46
46 -
 47
47 -
48
-
49
-
50
-
51
-
52
-
53
-
54
-
55
-
56
-
57
-
58
-
59
-
60
-
61
-
62
-
63
-
64
-
65
-
66
-
67
-
68
-
69
-
70
-
71
-
72
-
73
-
74
-
75
-
76
-
77
-
78
-
79
-
80
-
81
-
82
-
83
-
84
-
85
-
86
-
87
-
88
-
89
-
90
-
91
-
92
-
93
-
94
-
95
-
96
-
97
-
98
-
99
-
100
-
101
-
102
-
103
-
104
-
105
-
106
-
107
-
108
-
109
-
110
-
111
-
112
-
113
-
114
-
115
-
116
-
117
-
118
-
119
-
120
-
121
-
122
-
123
-
124
-
125
-
126
-
127
-
128
-
129
-
130
-
131
-
132
-
133
-
134
-
135
-
136
-
137
-
138
-
139
-
140
-
141
-
142
-
143
-
144
-
145
-
146
-
147
-
148
-
149
-
150
-
151
-
152
-
153
-
154
-
155
-
156
-
157
-
158
-
159
-
160
-
161
-
162
-
163
-
164
-
165
-
166
-
167
-
168
-
169
-
170
-
171
-
172
-
173
-
174
-
175
-
176
-
177
-
178
-
179
-
180
-
181
-
182
-
183
-
184
-
185
-
186
-
187
-
188
-
189
-
190
-
191
-
192
-
193
-
194
-
195
-
196
-
197
-
198
-
199
-
200
-
201
-
202
-
203
-
204
-
205
-
206
-
207
-
208
-
209
-
210
-
211
-
212
-
213
-
214
-
215
-
216
-
217
-
218
-
219
-
220
-
221
-
222
-
223
-
224
-
225
-
226
-
227
-
228
-
229
-
230
-
231
-
232
-
233
-
234
-
235
-
236
-
237
-
238
-
239
-
240
-
241
-
242
-
243
-
244
-
245
-
246
-
247
-
248
-
249
-
250
-
251
-
252
-
253
-
254
-
255
-
256
-
257
-
258
-
259
-
260
-
261
-
262
-
263
-
264
 |
 |

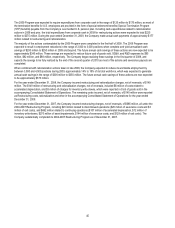
35
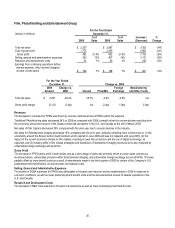
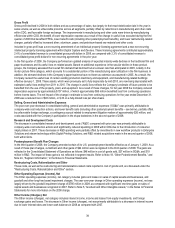
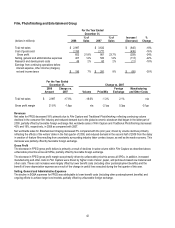
Film, Photofinishing and Entertainment Group
For the Year Ended
(dollars in millions) December 31,
2009
% of
Sales 2008
% of
Sales
Increase /
(Decrease)
%
Change
Total net sales $ 2,257 $ 2,987 $ (730) -24%
Cost of goods sold 1,775 2,335 (560) -24%
Gross profit 482 21.4% 652 21.8% (170) -26%
Selling, general and administrative expenses 290 13% 407 14% (117) -29%
Research and development costs 33 1% 49 2% (16) -33%
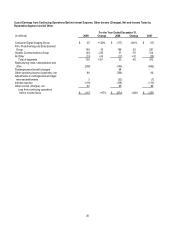
Earnings from continuing operations before
interest expense, other income (charges),
net and income taxes $ 159 7% $ 196 7% $ (37) -19%
For the Year Ended
December 31, Change vs. 2008
2009
Amount
Change vs.
2008 Volume Price/Mix
Foreign
Exchange
Manufacturing
and Other Costs
Total net sales $ 2,257 -24.4% -18.7% -2.9% -2.8% n/a
Gross profit margin 21.4% -0.4pp n/a -2.4pp -1.9pp 3.9pp
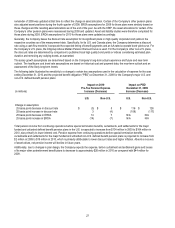
Revenues
The decrease in net sales for FPEG was driven by revenue declines across all SPGs within the segment.
Traditional Photofinishing sales decreased 24% in 2009 as compared with 2008, primarily driven by volume declines resulting from
the previously announced closure of the Qualex central lab operations in the U.S. and Canada at the end of March 2009.
Net sales of Film Capture decreased 38% compared with the prior year due to secular declines in the industry.
Net sales for Entertainment Imaging decreased 18% compared with the prior year, primarily reflecting lower volumes due to (1) the
uncertainty around the Screen Actors’ Guild contract, which expired in June 2008 and was not replaced until June 2009, (2) the
impact of the current economic climate on film makers, resulting in lower film production and the use of digital technology, as
expected, and (3) industry shifts in film release strategies and distribution. Entertainment Imaging revenues were also impacted by
unfavorable foreign exchange and price/mix.
Gross Profit
The decrease in FPEG gross profit in both dollars and as a percentage of sales was primarily driven by lower sales volumes as
mentioned above, unfavorable price/mix within Entertainment Imaging, and unfavorable foreign exchange across all SPGs. This was
partially offset by lower benefit costs as a result of amendments made in the third quarter of 2008 to certain of the Company’s U.S.
postemployment benefit plans, as well as lower raw material costs.
Selling, General and Administrative Expenses
The decline in SG&A expenses for FPEG was attributable to focused cost reduction actions implemented in 2009 in response to
economic conditions, as well as lower postemployment benefit costs and the aforementioned closure of Qualex operations in the
U.S. and Canada.
Research and Development Costs
The decrease in R&D costs was due to focused cost reductions as well as lower postemployment benefit costs.