Kodak 2009 Annual Report Download - page 54
Download and view the complete annual report
Please find page 54 of the 2009 Kodak annual report below. You can navigate through the pages in the report by either clicking on the pages listed below, or by using the keyword search tool below to find specific information within the annual report.-
 1
1 -
2
-
3
-
4
-
5
-
6
-
7
-
8
-
9
-
10
-
11
-
12
-
13
-
14
-
15
-
16
-
17
-
18
-
19
-
20
-
21
-
22
-
23
-
24
-
25
-
26
-
27
-
28
-
29
-
30
-
31
-
32
-
33
-
34
-
35
-
36
-
37
-
38
-
39
-
40
-
41
-
42
-
43
-
 44
44 -
 45
45 -
 46
46 -
 47
47 -
 48
48 -
 49
49 -
 50
50 -
 51
51 -
 52
52 -
 53
53 -
 54
54 -
 55
55 -
 56
56 -
 57
57 -
 58
58 -
 59
59 -
 60
60 -
 61
61 -
 62
62 -
 63
63 -
 64
64 -
65
-
66
-
67
-
68
-
69
-
70
-
71
-
72
-
73
-
74
-
75
-
76
-
77
-
78
-
79
-
80
-
81
-
82
-
83
-
84
-
85
-
86
-
87
-
88
-
89
-
90
-
91
-
92
-
93
-
94
-
95
-
96
-
97
-
98
-
99
-
100
-
101
-
102
-
103
-
104
-
105
-
106
-
107
-
108
-
109
-
110
-
111
-
112
-
113
-
114
-
115
-
116
-
117
-
118
-
119
-
120
-
121
-
122
-
123
-
124
-
125
-
126
-
127
-
128
-
129
-
130
-
131
-
132
-
133
-
134
-
135
-
136
-
137
-
138
-
139
-
140
-
141
-
142
-
143
-
144
-
145
-
146
-
147
-
148
-
149
-
150
-
151
-
152
-
153
-
154
-
155
-
156
-
157
-
158
-
159
-
160
-
161
-
162
-
163
-
164
-
165
-
166
-
167
-
168
-
169
-
170
-
171
-
172
-
173
-
174
-
175
-
176
-
177
-
178
-
179
-
180
-
181
-
182
-
183
-
184
-
185
-
186
-
187
-
188
-
189
-
190
-
191
-
192
-
193
-
194
-
195
-
196
-
197
-
198
-
199
-
200
-
201
-
202
-
203
-
204
-
205
-
206
-
207
-
208
-
209
-
210
-
211
-
212
-
213
-
214
-
215
-
216
-
217
-
218
-
219
-
220
-
221
-
222
-
223
-
224
-
225
-
226
-
227
-
228
-
229
-
230
-
231
-
232
-
233
-
234
-
235
-
236
-
237
-
238
-
239
-
240
-
241
-
242
-
243
-
244
-
245
-
246
-
247
-
248
-
249
-
250
-
251
-
252
-
253
-
254
-
255
-
256
-
257
-
258
-
259
-
260
-
261
-
262
-
263
-
264
 |
 |
52
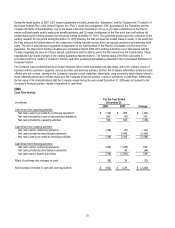
Operating Activities
Net cash used in continuing operations from operating activities increased $493 million. The key factor driving this change was the
overall decline in earnings for 2008 as compared with 2007, notably in the fourth quarter of 2008 as a consequence of the global
economic downturn. The Company's cash from operating activities benefited from lower restructuring payments in 2008 and receipt
of a tax refund from the U.S. Internal Revenue Service of $581 million, of which $270 million, which represents interest net of state
income tax, was reflected in loss from continuing operations during the year. However, the Company also recognized non-cash
curtailment gains during the year, and revenue for which cash was received in prior years or in 2009. In addition, net cash received
in 2008 for current and prior year non-recurring licensing arrangements of $150 million was $156 million lower than net cash
received in 2007 of $306 million. The Company also utilized $128 million more cash in 2008 as compared with 2007, due to an
increase in inventories during 2008, as compared with a decrease in inventories in 2007. Furthermore, the Company expended cash
in 2008 to reduce liabilities recorded as of the prior year end, which exceeded cash utilized in 2007 to liquidate liabilities as of year
end 2006. The combination of these and other factors led to the use of cash in continuing operations from operating activities of
$128 million in 2008, as compared with cash provided on the same basis of $365 million in 2007. Net cash provided by (used in)
discontinued operations increased $333 million as compared with the prior year due primarily to the receipt, in the second quarter of
2008, of the refund of past federal income taxes referred to above, and more fully described in Note 15, “Income Taxes,” in the
Notes to Financial Statements.
Investing Activities
Net cash used in continuing operations from investing activities increased $147 million for the year ended December 31, 2008 as
compared with 2007 due primarily to lower cash proceeds received from sales of assets and businesses of $92 million in 2008 as
compared with $227 million in 2007. Spending for capital additions was $254 million in 2008 as compared with $259 million in 2007.
The majority of this spending supports new products, manufacturing capacity, productivity and quality improvements, infrastructure
improvements, equipment placements with customers, and ongoing environmental and safety initiatives. Net cash provided by
discontinued operations for the year ended December 31, 2007 of $2,449 million represents the proceeds received from the sale of
the Health Group in the second quarter of 2007 and the sale of the Company’s shares of Hermes Precisa Pty. Limited (“HPA”) in the
fourth quarter of 2007.
Financing Activities
Net cash used in financing activities decreased $548 million for the year ended December 31, 2008 as compared with 2007 due to
lower repayments of borrowings, mainly due to the repayment of the Company’s Secured Term Debt in the second quarter of 2007
that was required as a result of the sale of the Health Group. These reductions in cash usage were partially offset by repurchases of
the Company’s common stock of $301 million in 2008.
Other
Refer to Note 10, "Commitments and Contingencies," in the Notes to Financial Statements for discussion regarding the Company's
undiscounted liabilities for environmental remediation costs, and other commitments and contingencies, including legal matters.
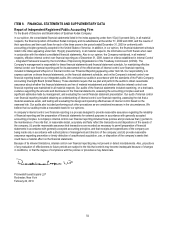
CAUTIONARY STATEMENT PURSUANT TO SAFE HARBOR PROVISIONS OF THE PRIVATE
SECURITIES LITIGATION REFORM ACT OF 1995
Certain statements in this report may be forward-looking in nature, or "forward-looking statements" as defined in the United States
Private Securities Litigation Reform Act of 1995. For example, references to the Company's expectations regarding the following are
forward-looking statements: revenue; revenue growth; cost of goods sold; gross margins; selling, general and administrative
expenses; research and development costs; savings from restructuring and rationalization; earnings; cash generation; increased
demand for our products, including commercial inkjet, consumer inkjet, workflow software and digital packaging printing solutions;
new product introductions; potential revenue, cash and earnings from intellectual property licensing; liquidity; and benefit costs.
Actual results may differ from those expressed or implied in forward-looking statements. Important factors that could cause actual
results to differ materially from the forward-looking statements include, among others, the risks, uncertainties, assumptions and
factors specified in Item 1A. "Risk Factors," "Management's Discussion and Analysis of Financial Condition and Results of
Operations," and "Cautionary Statement Pursuant to Safe Harbor Provisions the Private Litigation Reform Act of 1995" and in other
filings the Company makes with the SEC from time to time. The Company cautions readers to carefully consider such factors. Many
of these factors are beyond the Company’s control. In addition, any forward-looking statements represent the Company’s estimates
only as of the date they are made, and should not be relied upon as representing the Company’s estimates as of any subsequent
date. While the Company may elect to update forward-looking statements at some point in the future, the Company specifically
disclaims any obligation to do so, even if its estimates change.
Any forward-looking statements in this report should be evaluated in light of the factors and uncertainties referenced above and
should not be unduly relied upon.