Kodak 2009 Annual Report Download - page 195
Download and view the complete annual report
Please find page 195 of the 2009 Kodak annual report below. You can navigate through the pages in the report by either clicking on the pages listed below, or by using the keyword search tool below to find specific information within the annual report.-
 1
1 -
2
-
3
-
4
-
5
-
6
-
7
-
8
-
9
-
10
-
11
-
12
-
13
-
14
-
15
-
16
-
17
-
18
-
19
-
20
-
21
-
22
-
23
-
24
-
25
-
26
-
27
-
28
-
29
-
30
-
31
-
32
-
33
-
34
-
35
-
36
-
37
-
38
-
39
-
40
-
41
-
42
-
43
-
44
-
45
-
46
-
47
-
48
-
49
-
50
-
51
-
52
-
53
-
54
-
55
-
56
-
57
-
58
-
59
-
60
-
61
-
62
-
63
-
64
-
65
-
66
-
67
-
68
-
69
-
70
-
71
-
72
-
73
-
74
-
75
-
76
-
77
-
78
-
79
-
80
-
81
-
82
-
83
-
84
-
85
-
86
-
87
-
88
-
89
-
90
-
91
-
92
-
93
-
94
-
95
-
96
-
97
-
98
-
99
-
100
-
101
-
102
-
103
-
104
-
105
-
106
-
107
-
108
-
109
-
110
-
111
-
112
-
113
-
114
-
115
-
116
-
117
-
118
-
119
-
120
-
121
-
122
-
123
-
124
-
125
-
126
-
127
-
128
-
129
-
130
-
131
-
132
-
133
-
134
-
135
-
136
-
137
-
138
-
139
-
140
-
141
-
142
-
143
-
144
-
145
-
146
-
147
-
148
-
149
-
150
-
151
-
152
-
153
-
154
-
155
-
156
-
157
-
158
-
159
-
160
-
161
-
162
-
163
-
164
-
165
-
166
-
167
-
168
-
169
-
170
-
171
-
172
-
173
-
174
-
175
-
176
-
177
-
178
-
179
-
180
-
181
-
182
-
183
-
184
-
 185
185 -
 186
186 -
 187
187 -
 188
188 -
 189
189 -
 190
190 -
 191
191 -
 192
192 -
 193
193 -
 194
194 -
 195
195 -
 196
196 -
 197
197 -
 198
198 -
 199
199 -
 200
200 -
 201
201 -
 202
202 -
 203
203 -
 204
204 -
 205
205 -
206
-
207
-
208
-
209
-
210
-
211
-
212
-
213
-
214
-
215
-
216
-
217
-
218
-
219
-
220
-
221
-
222
-
223
-
224
-
225
-
226
-
227
-
228
-
229
-
230
-
231
-
232
-
233
-
234
-
235
-
236
-
237
-
238
-
239
-
240
-
241
-
242
-
243
-
244
-
245
-
246
-
247
-
248
-
249
-
250
-
251
-
252
-
253
-
254
-
255
-
256
-
257
-
258
-
259
-
260
-
261
-
262
-
263
-
264
 |
 |

51
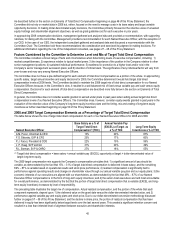
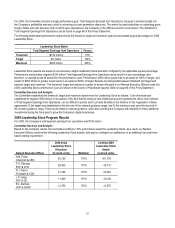
For 2009, the Committee selected a single performance goal, Total Segment Earnings from Operations, because it provides insight into
the Company’s profitability and was critical to achieving our cash generation objectives. This metric focused executives on optimizing gross
margin dollars and cost structure, both of which were imperative to the Company in the difficult economic environment. The definition for
Total Segment Earnings from Operations can be found on page 68 of this Proxy Statement.
The following abbreviated performance matrix shows the threshold, target and maximum goal and associated payout percentage for 2009
Leadership Stock:
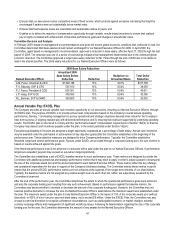
Leadership Stock Matrix
Total Segment Earnings from Operations
Payout
Threshold
($150 million)
10%
Target
$0 million
100%
Maximum
$200 million
200%
Leadership Stock awards are based on an executive’s target Leadership Stock allocation multiplied by the applicable payout percentage.
Performance results below negative $150 million Total Segment Earnings from Operations would result in a zero percentage, and,
therefore, no awards would be earned for the performance cycle. Performance at $0 million would lead to an award at 100% of target, and
results of $200 million or greater would result in an award at 200% of target. Results are interpolated between threshold and target and
between target and maximum. The threshold, target and maximum number of shares allocated to our Named Executive Officers under the
2009 Leadership Stock performance cycle are shown in the Grants of Plan-Based Awards Table on page 66 of this Proxy Statement.
Committee Decision and Analysis
The Committee established the threshold, target and maximum award levels for Leadership Stock as follows: 1) the threshold was
established at negative $150 million in recognition of the fact that the timing of new intellectual property agreements, which is an element
of Total Segment Earnings from Operations, can be difficult to predict and to provide flexibility in the timeline for the negotiation of these
agreements; 2) the target was established at the low-end of the external guidance range; and 3) the maximum was set at the top end of
the investor guidance range. These levels relate to external guidance, while also providing the Company with flexibility to make additional
investments during the fiscal year to grow the Company’s digital businesses.
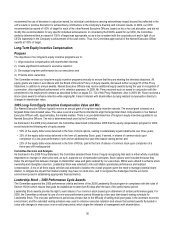
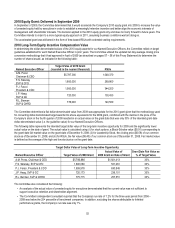
2009 Leadership Stock Program Results
For 2009, the Company’s total segment earnings from operations was $139 million.
Committee Decision and Analysis
Based on the Company results, the Committee certified a 170% performance award for Leadership Stock. As a result, our Named
Executive Officers received the following Leadership Stock awards, with payout contingent on satisfaction of an additional two-year time-
based vesting requirement:
Named Executive Officer
2009 Initial
Leadership Stock
Allocation
(in stock units)
Multiplier
Certified 2009
Leadership Stock
Award
(in stock units)
A.M. Perez
Chairman & CEO
95,120
170%
161,704
F.S. Sklarsky
EVP & CFO
26,300
170%
44,710
P.J. Faraci
President & COO
31,230
170%
53,091
J.P. Haag
SVP & GC
11,840
170%
20,128
R.L. Berman
SVP & CHRO
12,750
170%
21,675