Kodak 2009 Annual Report Download - page 29
Download and view the complete annual report
Please find page 29 of the 2009 Kodak annual report below. You can navigate through the pages in the report by either clicking on the pages listed below, or by using the keyword search tool below to find specific information within the annual report.-
 1
1 -
2
-
3
-
4
-
5
-
6
-
7
-
8
-
9
-
10
-
11
-
12
-
13
-
14
-
15
-
16
-
17
-
18
-
 19
19 -
 20
20 -
 21
21 -
 22
22 -
 23
23 -
 24
24 -
 25
25 -
 26
26 -
 27
27 -
 28
28 -
 29
29 -
 30
30 -
 31
31 -
 32
32 -
 33
33 -
 34
34 -
 35
35 -
 36
36 -
 37
37 -
 38
38 -
 39
39 -
40
-
41
-
42
-
43
-
44
-
45
-
46
-
47
-
48
-
49
-
50
-
51
-
52
-
53
-
54
-
55
-
56
-
57
-
58
-
59
-
60
-
61
-
62
-
63
-
64
-
65
-
66
-
67
-
68
-
69
-
70
-
71
-
72
-
73
-
74
-
75
-
76
-
77
-
78
-
79
-
80
-
81
-
82
-
83
-
84
-
85
-
86
-
87
-
88
-
89
-
90
-
91
-
92
-
93
-
94
-
95
-
96
-
97
-
98
-
99
-
100
-
101
-
102
-
103
-
104
-
105
-
106
-
107
-
108
-
109
-
110
-
111
-
112
-
113
-
114
-
115
-
116
-
117
-
118
-
119
-
120
-
121
-
122
-
123
-
124
-
125
-
126
-
127
-
128
-
129
-
130
-
131
-
132
-
133
-
134
-
135
-
136
-
137
-
138
-
139
-
140
-
141
-
142
-
143
-
144
-
145
-
146
-
147
-
148
-
149
-
150
-
151
-
152
-
153
-
154
-
155
-
156
-
157
-
158
-
159
-
160
-
161
-
162
-
163
-
164
-
165
-
166
-
167
-
168
-
169
-
170
-
171
-
172
-
173
-
174
-
175
-
176
-
177
-
178
-
179
-
180
-
181
-
182
-
183
-
184
-
185
-
186
-
187
-
188
-
189
-
190
-
191
-
192
-
193
-
194
-
195
-
196
-
197
-
198
-
199
-
200
-
201
-
202
-
203
-
204
-
205
-
206
-
207
-
208
-
209
-
210
-
211
-
212
-
213
-
214
-
215
-
216
-
217
-
218
-
219
-
220
-
221
-
222
-
223
-
224
-
225
-
226
-
227
-
228
-
229
-
230
-
231
-
232
-
233
-
234
-
235
-
236
-
237
-
238
-
239
-
240
-
241
-
242
-
243
-
244
-
245
-
246
-
247
-
248
-
249
-
250
-
251
-
252
-
253
-
254
-
255
-
256
-
257
-
258
-
259
-
260
-
261
-
262
-
263
-
264
 |
 |

27
remainder of 2009 was updated at that time to reflect the change in asset allocation. Certain of the Company’s other pension plans
also adjusted asset positions during the fourth quarter of 2008. EROA assumptions for 2009 for those plans were similarly based on
these changes and the resulting asset allocations as of the end of the year. As with the KRIP, the asset allocations for certain of the
Company’s other pension plans were reassessed during 2009 and updated. Asset and liability studies were therefore completed for
those plans during 2009. EROA assumptions for 2010 for those plans were updated accordingly.
Generally, the Company bases the discount rate assumption for its significant plans on high quality corporate bond yields in the
respective countries as of the measurement date. Specifically, for its U.S. and Canada plans, the Company determines a discount
rate using a cash flow model to incorporate the expected timing of benefit payments and an AA-rated corporate bond yield curve. For
the Company's U.S. plans, the Citigroup Above Median Pension Discount Curve is used. For the Company’s other non-U.S. plans,
the discount rates are determined by comparison to published local high quality bond yields or indices considering estimated plan
duration and removing any outlying bonds, as warranted.
The salary growth assumptions are determined based on the Company’s long-term actual experience and future and near-term
outlook. The healthcare cost trend rate assumptions are based on historical cost and payment data, the near-term outlook and an
assessment of the likely long-term trends.
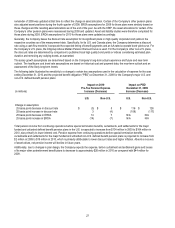
The following table illustrates the sensitivity to a change to certain key assumptions used in the calculation of expense for the year
ending December 31, 2010 and the projected benefit obligation (“PBO”) at December 31, 2009 for the Company's major U.S. and
non-U.S. defined benefit pension plans:
(in millions)
Impact on 2010
Pre-Tax Pension Expense
Increase (Decrease)
Impact on PBO
December 31, 2009
Increase (Decrease)
U.S. Non-U.S. U.S. Non-U.S.
Change in assumption:
25 basis point decrease in discount rate $ (3) $ 5 $ 116 $ 126
25 basis point increase in discount rate 3 (4) (108) (117)
25 basis point decrease in EROA 14 7 N/A N/A
25 basis point increase in EROA (14) (7) N/A N/A
Total pension income from continuing operations before special termination benefits, curtailments, and settlements for the major
funded and unfunded defined benefit pension plans in the U.S. is expected to increase from $134 million in 2009 to $164 million in
2010, due primarily to lower interest cost. Pension expense from continuing operations before special termination benefits,
curtailments and settlements for the major funded and unfunded non-U.S. defined benefit pension plans is projected to increase from
$2 million in 2009 to $18 million in 2010, which is primarily attributable to lower discount rates and higher inflation. Absent a recovery
of asset values, net pension income will decline in future years.
Additionally, due to changes in plan design, the Company expects the expense, before curtailment and settlement gains and losses
of its major other postretirement benefit plans to decrease to approximately $26 million in 2010 as compared with $44 million for
2009.