Kodak 2009 Annual Report Download - page 46
Download and view the complete annual report
Please find page 46 of the 2009 Kodak annual report below. You can navigate through the pages in the report by either clicking on the pages listed below, or by using the keyword search tool below to find specific information within the annual report.-
 1
1 -
2
-
3
-
4
-
5
-
6
-
7
-
8
-
9
-
10
-
11
-
12
-
13
-
14
-
15
-
16
-
17
-
18
-
19
-
20
-
21
-
22
-
23
-
24
-
25
-
26
-
27
-
28
-
29
-
30
-
31
-
32
-
33
-
34
-
35
-
 36
36 -
 37
37 -
 38
38 -
 39
39 -
 40
40 -
 41
41 -
 42
42 -
 43
43 -
 44
44 -
 45
45 -
 46
46 -
 47
47 -
 48
48 -
 49
49 -
 50
50 -
 51
51 -
 52
52 -
 53
53 -
 54
54 -
 55
55 -
 56
56 -
57
-
58
-
59
-
60
-
61
-
62
-
63
-
64
-
65
-
66
-
67
-
68
-
69
-
70
-
71
-
72
-
73
-
74
-
75
-
76
-
77
-
78
-
79
-
80
-
81
-
82
-
83
-
84
-
85
-
86
-
87
-
88
-
89
-
90
-
91
-
92
-
93
-
94
-
95
-
96
-
97
-
98
-
99
-
100
-
101
-
102
-
103
-
104
-
105
-
106
-
107
-
108
-
109
-
110
-
111
-
112
-
113
-
114
-
115
-
116
-
117
-
118
-
119
-
120
-
121
-
122
-
123
-
124
-
125
-
126
-
127
-
128
-
129
-
130
-
131
-
132
-
133
-
134
-
135
-
136
-
137
-
138
-
139
-
140
-
141
-
142
-
143
-
144
-
145
-
146
-
147
-
148
-
149
-
150
-
151
-
152
-
153
-
154
-
155
-
156
-
157
-
158
-
159
-
160
-
161
-
162
-
163
-
164
-
165
-
166
-
167
-
168
-
169
-
170
-
171
-
172
-
173
-
174
-
175
-
176
-
177
-
178
-
179
-
180
-
181
-
182
-
183
-
184
-
185
-
186
-
187
-
188
-
189
-
190
-
191
-
192
-
193
-
194
-
195
-
196
-
197
-
198
-
199
-
200
-
201
-
202
-
203
-
204
-
205
-
206
-
207
-
208
-
209
-
210
-
211
-
212
-
213
-
214
-
215
-
216
-
217
-
218
-
219
-
220
-
221
-
222
-
223
-
224
-
225
-
226
-
227
-
228
-
229
-
230
-
231
-
232
-
233
-
234
-
235
-
236
-
237
-
238
-
239
-
240
-
241
-
242
-
243
-
244
-
245
-
246
-
247
-
248
-
249
-
250
-
251
-
252
-
253
-
254
-
255
-
256
-
257
-
258
-
259
-
260
-
261
-
262
-
263
-
264
 |
 |
44
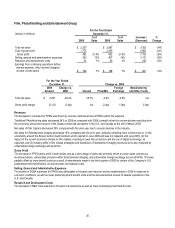
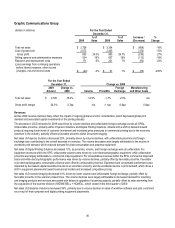
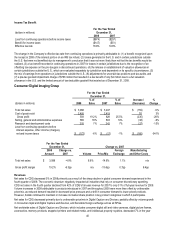
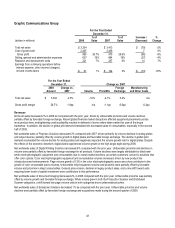
Gross Profit
The decline in gross profit dollars and margin was primarily driven by Prepress Solutions and Digital Printing Solutions. Increased
manufacturing costs related to aluminum and petroleum-based raw materials, as well as higher distribution expense and volume
declines, drove the decrease in the Prepress Solutions gross profit dollars and margin. For Digital Printing Solutions, higher costs of
newly introduced digital printers, price erosion and adverse mix were partially offset by manufacturing cost productivity.
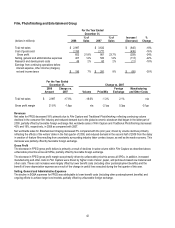
Selling, General and Administrative Expenses
The decrease in SG&A expenses for GCG primarily reflects lower benefit costs (including other postemployment benefits) and
ongoing efforts to achieve target cost models, partially offset by increased costs associated with the Company’s participation in the
drupa tradeshow in the second quarter of 2008, go-to-market investments, and unfavorable foreign exchange.
Research and Development Costs
The increase in R&D costs for GCG was primarily driven by investments in new workflow products in Enterprise Solutions, R&D
related to acquisitions made in the second quarter of 2008, increased investments for stream technology within Digital Printing
Solutions, and unfavorable foreign exchange. These increases were partially offset by ongoing efforts to achieve target cost models.
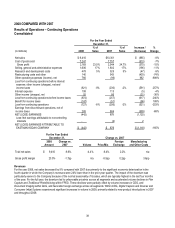
Results of Operations – Discontinued Operations
Total Company earnings from discontinued operations for the year ended December 31, 2008 and 2007 of $285 million and $884
million, respectively, include a benefit for income taxes of $288 million and a provision for income taxes of $262 million, respectively.
Earnings from discontinued operations in 2008 were primarily driven by a tax refund that the Company received from the U.S.
Internal Revenue Service. The refund was related to the audit of certain claims filed for tax years 1993-1998. A portion of the refund
related to past federal income taxes paid in relation to the 1994 sale of a subsidiary, Sterling Winthrop Inc., which was reported in
discontinued operations. Refer to Note 15, “Income Taxes,” in the Notes to Financial Statements for further discussion of the tax
refund.
Earnings from discontinued operations in 2007 were primarily driven by the $986 million pre-tax gain on the sale of the Health Group
segment on April 30, 2007, and the $123 million pre-tax gain on the sale of Hermes Precisa Pty. Ltd. (“HPA”) on November 2, 2007.
Also included in discontinued operations in 2007 are the results of operations of the Health Group segment and HPA through their
respective dates of sale.
For a detailed discussion of the components of discontinued operations, refer to Note 22, “Discontinued Operations,” in the Notes to
Financial Statements.
Net (Loss) Earnings Attributable to Eastman Kodak Company
The Company’s consolidated net loss attributable to Eastman Kodak Company for 2008 was $442 million, or a loss of $1.57 per
basic and diluted share, as compared with net earnings attributable to Eastman Kodak Company for 2007 of $676 million, or
earnings of $2.35 per basic and diluted share, representing a decrease of $1,118 million or 165%. This decrease is attributable to
the reasons outlined above.
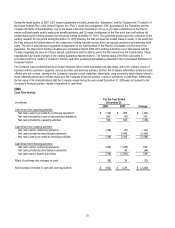
Restructuring Costs, Rationalization and Other
On December 17, 2008, the Company committed to a plan to implement a targeted cost reduction program (the 2009 Program) to
more appropriately size the organization as a result of the current economic environment. The program involved rationalizing selling,
administrative, research and development, supply chain and other business resources in certain areas and consolidating certain
facilities. The execution of the 2009 Program began in January 2009.
In connection with the 2009 Program, the Company expected to incur total restructuring charges in the range of $250 million to $300
million, including $225 million to $265 million of cash related charges for termination benefits and other exit costs, and $25 million to
$35 million of non-cash related accelerated depreciation and asset write-offs. The Company recorded actual charges of $258 million,
net of reversals, including $22 million of charges for accelerated depreciation and $10 million of charges for inventory write-downs,
which were reported in Cost of goods sold in the accompanying Consolidated Statement of Operations for the year ended December
31, 2009. The remaining costs incurred, net of reversals, of $226 million were reported as Restructuring costs, rationalization and
other in the accompanying Consolidated Statement of Operations for the year ended December 31, 2009. The severance and exit
costs reserves require the outlay of cash, while long-lived asset impairments, accelerated depreciation and inventory write-downs
represent non-cash items. The charges, net of reversals, of $258 million recorded in 2009 included $69 million applicable to FPEG,
$34 million applicable to CDG, $112 million applicable to GCG, and $43 million that was applicable to manufacturing, research and
development, and administrative functions, which were shared across all segments.