Kodak 2009 Annual Report Download - page 101
Download and view the complete annual report
Please find page 101 of the 2009 Kodak annual report below. You can navigate through the pages in the report by either clicking on the pages listed below, or by using the keyword search tool below to find specific information within the annual report.-
 1
1 -
2
-
3
-
4
-
5
-
6
-
7
-
8
-
9
-
10
-
11
-
12
-
13
-
14
-
15
-
16
-
17
-
18
-
19
-
20
-
21
-
22
-
23
-
24
-
25
-
26
-
27
-
28
-
29
-
30
-
31
-
32
-
33
-
34
-
35
-
36
-
37
-
38
-
39
-
40
-
41
-
42
-
43
-
44
-
45
-
46
-
47
-
48
-
49
-
50
-
51
-
52
-
53
-
54
-
55
-
56
-
57
-
58
-
59
-
60
-
61
-
62
-
63
-
64
-
65
-
66
-
67
-
68
-
69
-
70
-
71
-
72
-
73
-
74
-
75
-
76
-
77
-
78
-
79
-
80
-
81
-
82
-
83
-
84
-
85
-
86
-
87
-
88
-
89
-
90
-
 91
91 -
 92
92 -
 93
93 -
 94
94 -
 95
95 -
 96
96 -
 97
97 -
 98
98 -
 99
99 -
 100
100 -
 101
101 -
 102
102 -
 103
103 -
 104
104 -
 105
105 -
 106
106 -
 107
107 -
 108
108 -
 109
109 -
 110
110 -
 111
111 -
112
-
113
-
114
-
115
-
116
-
117
-
118
-
119
-
120
-
121
-
122
-
123
-
124
-
125
-
126
-
127
-
128
-
129
-
130
-
131
-
132
-
133
-
134
-
135
-
136
-
137
-
138
-
139
-
140
-
141
-
142
-
143
-
144
-
145
-
146
-
147
-
148
-
149
-
150
-
151
-
152
-
153
-
154
-
155
-
156
-
157
-
158
-
159
-
160
-
161
-
162
-
163
-
164
-
165
-
166
-
167
-
168
-
169
-
170
-
171
-
172
-
173
-
174
-
175
-
176
-
177
-
178
-
179
-
180
-
181
-
182
-
183
-
184
-
185
-
186
-
187
-
188
-
189
-
190
-
191
-
192
-
193
-
194
-
195
-
196
-
197
-
198
-
199
-
200
-
201
-
202
-
203
-
204
-
205
-
206
-
207
-
208
-
209
-
210
-
211
-
212
-
213
-
214
-
215
-
216
-
217
-
218
-
219
-
220
-
221
-
222
-
223
-
224
-
225
-
226
-
227
-
228
-
229
-
230
-
231
-
232
-
233
-
234
-
235
-
236
-
237
-
238
-
239
-
240
-
241
-
242
-
243
-
244
-
245
-
246
-
247
-
248
-
249
-
250
-
251
-
252
-
253
-
254
-
255
-
256
-
257
-
258
-
259
-
260
-
261
-
262
-
263
-
264
 |
 |

99
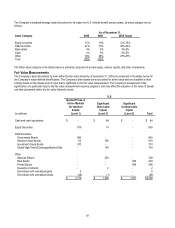
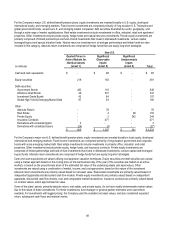
For all of the Company’s major defined benefit pension plans, investment managers are selected that are expected to provide best-
in-class asset management for their particular asset class, and expected returns greater than those expected from existing salable
assets, especially if this would maintain the aggregate volatility desired for each plan’s portfolio. Investment managers are retained
for the purpose of managing specific investment strategies within contractual investment guidelines. Certain investment managers
are authorized to invest in derivatives such as futures, swaps and currency forward contracts. These investments are used to
achieve targeted exposure to particular index or bond duration, provide value-added returns between asset classes, and to partially
hedge foreign currency risk. Additionally, the Company’s major defined benefit pension plans invest in government bond futures or
local government bonds to partially hedge the liability risk of the plans.
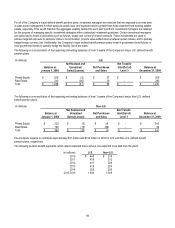
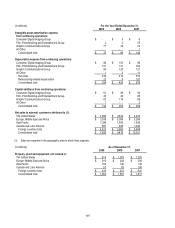
The following is a reconciliation of the beginning and ending balances of level 3 assets of the Company’s major U.S. defined benefit
pension plans:
(in millions) U.S.
Balance at
January 1, 2009
Net Realized and
Unrealized
Gains/(Losses)
Net Purchases
and Sales
Net Transfer
Into/(Out of)
Level 3
Balance at
December 31, 2009
Private Equity $ 926 $ (5) $ 37 $ - $ 958
Real Estate 310 (36) 19 - 293
Total $ 1,236 $ (41) $ 56 $ - $ 1,251
The following is a reconciliation of the beginning and ending balances of level 3 assets of the Company’s major Non-U.S. defined
benefit pension plans:
(in millions) Non-U.S.
Balance at
January 1, 2009
Net Realized and
Unrealized
Gains/(Losses)
Net Purchases
and Sales
Net Transfer
Into/(Out of)
Level 3
Balance at
December 31, 2009
Private Equity $ 223 $ (5) $ 24 $ - $ 242
Real Estate 140 (15) (26) - 99
Total $ 363 $ (20) $ (2) $ - $ 341
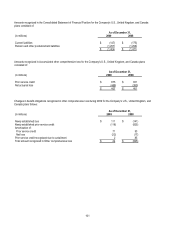
The Company expects to contribute approximately $31 million and $104 million in 2010 for U.S. and Non-U.S. defined benefit
pension plans, respectively.
The following pension benefit payments, which reflect expected future service, are expected to be paid from the plans:
(in millions) U.S. Non-U.S.
2010 $ 448 $ 218
2011 418 212
2012 410 208
2013 418 204
2014 395 200
2015-2019 1,893 1,009