Kodak 2009 Annual Report Download - page 65
Download and view the complete annual report
Please find page 65 of the 2009 Kodak annual report below. You can navigate through the pages in the report by either clicking on the pages listed below, or by using the keyword search tool below to find specific information within the annual report.-
 1
1 -
2
-
3
-
4
-
5
-
6
-
7
-
8
-
9
-
10
-
11
-
12
-
13
-
14
-
15
-
16
-
17
-
18
-
19
-
20
-
21
-
22
-
23
-
24
-
25
-
26
-
27
-
28
-
29
-
30
-
31
-
32
-
33
-
34
-
35
-
36
-
37
-
38
-
39
-
40
-
41
-
42
-
43
-
44
-
45
-
46
-
47
-
48
-
49
-
50
-
51
-
52
-
53
-
54
-
 55
55 -
 56
56 -
 57
57 -
 58
58 -
 59
59 -
 60
60 -
 61
61 -
 62
62 -
 63
63 -
 64
64 -
 65
65 -
 66
66 -
 67
67 -
 68
68 -
 69
69 -
 70
70 -
 71
71 -
 72
72 -
 73
73 -
 74
74 -
 75
75 -
76
-
77
-
78
-
79
-
80
-
81
-
82
-
83
-
84
-
85
-
86
-
87
-
88
-
89
-
90
-
91
-
92
-
93
-
94
-
95
-
96
-
97
-
98
-
99
-
100
-
101
-
102
-
103
-
104
-
105
-
106
-
107
-
108
-
109
-
110
-
111
-
112
-
113
-
114
-
115
-
116
-
117
-
118
-
119
-
120
-
121
-
122
-
123
-
124
-
125
-
126
-
127
-
128
-
129
-
130
-
131
-
132
-
133
-
134
-
135
-
136
-
137
-
138
-
139
-
140
-
141
-
142
-
143
-
144
-
145
-
146
-
147
-
148
-
149
-
150
-
151
-
152
-
153
-
154
-
155
-
156
-
157
-
158
-
159
-
160
-
161
-
162
-
163
-
164
-
165
-
166
-
167
-
168
-
169
-
170
-
171
-
172
-
173
-
174
-
175
-
176
-
177
-
178
-
179
-
180
-
181
-
182
-
183
-
184
-
185
-
186
-
187
-
188
-
189
-
190
-
191
-
192
-
193
-
194
-
195
-
196
-
197
-
198
-
199
-
200
-
201
-
202
-
203
-
204
-
205
-
206
-
207
-
208
-
209
-
210
-
211
-
212
-
213
-
214
-
215
-
216
-
217
-
218
-
219
-
220
-
221
-
222
-
223
-
224
-
225
-
226
-
227
-
228
-
229
-
230
-
231
-
232
-
233
-
234
-
235
-
236
-
237
-
238
-
239
-
240
-
241
-
242
-
243
-
244
-
245
-
246
-
247
-
248
-
249
-
250
-
251
-
252
-
253
-
254
-
255
-
256
-
257
-
258
-
259
-
260
-
261
-
262
-
263
-
264
 |
 |
63
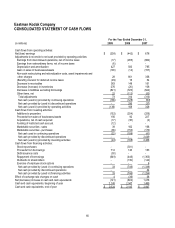
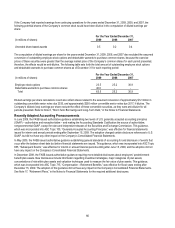
The effects of foreign currency transactions, including related hedging activities, are included in Other income (charges), net, in the
accompanying Consolidated Statement of Operations.
Concentration of Credit Risk
Financial instruments that potentially subject the Company to significant concentrations of credit risk consist principally of cash and
cash equivalents, receivables, and derivative instruments. The Company places its cash and cash equivalents with high-quality
financial institutions and limits the amount of credit exposure to any one institution. With respect to receivables, such receivables
arise from sales to numerous customers in a variety of industries, markets, and geographies around the world. Receivables arising
from these sales are generally not collateralized. The Company performs ongoing credit evaluations of its customers’ financial
conditions and no single customer accounts for greater than 10% of the sales of the Company. The Company maintains reserves for
potential credit losses and such losses, in the aggregate, have not exceeded management’s expectations. With respect to the
derivative instruments, the counterparties to these contracts are major financial institutions. The Company has not experienced non-
performance by any of its derivative instruments counterparties.
Derivative Financial Instruments
All derivative instruments are recognized as either assets or liabilities and are measured at fair value. Certain derivatives are
designated and accounted for as hedges. The Company does not use derivatives for trading or other speculative purposes. See
Note 12, “Financial Instruments,” in the Notes to Financial Statements.
Cash Equivalents
All highly liquid investments with a remaining maturity of three months or less at date of purchase are considered to be cash
equivalents.
Inventories
Inventories are stated at the lower of cost or market. The cost of all of the Company’s inventories is determined by either the “first in,
first out” (“FIFO”) or average cost method, which approximates current cost. The Company provides inventory reserves for excess,
obsolete or slow-moving inventory based on changes in customer demand, technology developments or other economic factors.
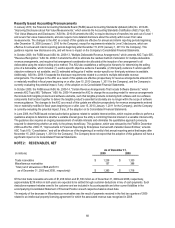
Properties
Properties are recorded at cost, net of accumulated depreciation. The Company capitalizes additions and improvements.
Maintenance and repairs are charged to expense as incurred. The Company calculates depreciation expense using the straight-line
method over the assets’ estimated useful lives, which are as follows:
Years
Buildings and building improvements 5-40
Land improvements 20
Leasehold improvements 3-20
Equipment 3-15
Tooling 1-3
Furniture and fixtures 5-10
The Company depreciates leasehold improvements over the shorter of the lease term or the asset’s estimated useful life. Upon sale
or other disposition, the applicable amounts of asset cost and accumulated depreciation are removed from the accounts and the net
amount, less proceeds from disposal, is charged or credited to net (loss) earnings.
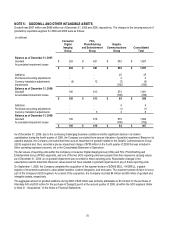
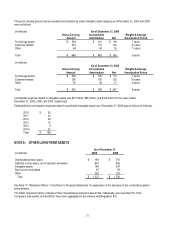
Goodwill
Goodwill represents the excess of purchase price of an acquisition over the fair value of net assets acquired. Goodwill is not
amortized, but is required to be assessed for impairment at least annually. The Company has elected to make September 30 the
annual impairment assessment date for all of its reporting units, and will perform additional impairment tests when events or changes
in circumstances occur that would more likely than not reduce the fair value of the reporting unit below its carrying amount. A
reporting unit is defined as an operating segment or one level below an operating segment. The Company estimates the fair value of
its reporting units utilizing income and market approaches through the application of discounted cash flow and market comparable
methods, respectively. The assessment is required to be performed in two steps, step one to test for a potential impairment of
goodwill and, if potential losses are identified, step two to measure the impairment loss. Determining the fair value of a reporting unit
involves the use of significant estimates and assumptions.
The Company recorded a pre-tax goodwill impairment charge of $785 million in the fourth quarter of 2008. See Note 5, “Goodwill
and Other Intangible Assets,” in the Notes to the Financial Statements.