Kodak 2009 Annual Report Download - page 192
Download and view the complete annual report
Please find page 192 of the 2009 Kodak annual report below. You can navigate through the pages in the report by either clicking on the pages listed below, or by using the keyword search tool below to find specific information within the annual report.-
 1
1 -
2
-
3
-
4
-
5
-
6
-
7
-
8
-
9
-
10
-
11
-
12
-
13
-
14
-
15
-
16
-
17
-
18
-
19
-
20
-
21
-
22
-
23
-
24
-
25
-
26
-
27
-
28
-
29
-
30
-
31
-
32
-
33
-
34
-
35
-
36
-
37
-
38
-
39
-
40
-
41
-
42
-
43
-
44
-
45
-
46
-
47
-
48
-
49
-
50
-
51
-
52
-
53
-
54
-
55
-
56
-
57
-
58
-
59
-
60
-
61
-
62
-
63
-
64
-
65
-
66
-
67
-
68
-
69
-
70
-
71
-
72
-
73
-
74
-
75
-
76
-
77
-
78
-
79
-
80
-
81
-
82
-
83
-
84
-
85
-
86
-
87
-
88
-
89
-
90
-
91
-
92
-
93
-
94
-
95
-
96
-
97
-
98
-
99
-
100
-
101
-
102
-
103
-
104
-
105
-
106
-
107
-
108
-
109
-
110
-
111
-
112
-
113
-
114
-
115
-
116
-
117
-
118
-
119
-
120
-
121
-
122
-
123
-
124
-
125
-
126
-
127
-
128
-
129
-
130
-
131
-
132
-
133
-
134
-
135
-
136
-
137
-
138
-
139
-
140
-
141
-
142
-
143
-
144
-
145
-
146
-
147
-
148
-
149
-
150
-
151
-
152
-
153
-
154
-
155
-
156
-
157
-
158
-
159
-
160
-
161
-
162
-
163
-
164
-
165
-
166
-
167
-
168
-
169
-
170
-
171
-
172
-
173
-
174
-
175
-
176
-
177
-
178
-
179
-
180
-
181
-
 182
182 -
 183
183 -
 184
184 -
 185
185 -
 186
186 -
 187
187 -
 188
188 -
 189
189 -
 190
190 -
 191
191 -
 192
192 -
 193
193 -
 194
194 -
 195
195 -
 196
196 -
 197
197 -
 198
198 -
 199
199 -
 200
200 -
 201
201 -
 202
202 -
203
-
204
-
205
-
206
-
207
-
208
-
209
-
210
-
211
-
212
-
213
-
214
-
215
-
216
-
217
-
218
-
219
-
220
-
221
-
222
-
223
-
224
-
225
-
226
-
227
-
228
-
229
-
230
-
231
-
232
-
233
-
234
-
235
-
236
-
237
-
238
-
239
-
240
-
241
-
242
-
243
-
244
-
245
-
246
-
247
-
248
-
249
-
250
-
251
-
252
-
253
-
254
-
255
-
256
-
257
-
258
-
259
-
260
-
261
-
262
-
263
-
264
 |
 |

48
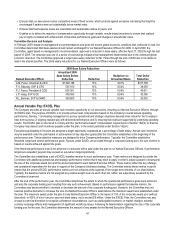
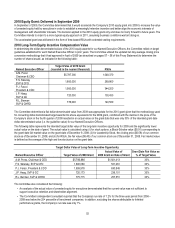
EXCEL Target Opportunity
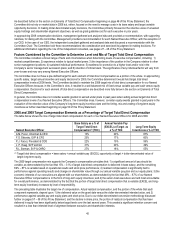
As noted above, our Named Executive Officers are assigned target opportunities based on a percentage of base salary. For 2009, the
target EXCEL opportunities as a percent of base salary for our Named Executive Officers were: 155% for Mr. Perez, 85% for Mr. Faraci,
75% for Mr. Sklarsky and 65% for Ms. Haag and Mr. Berman. For our former Named Executive Officer, Ms. Hellyar, the target was 65%.
Committee Decision and Analysis
For 2009, the Committee determined that the target EXCEL opportunity for our Named Executive Officers would remain at the same level
as in 2008, due to the challenging economic environment and management’s decision to provide no increase in salary or annual variable
pay targets for executives, except in limited cases where an executive made a job change resulting in significantly increased
responsibilities.
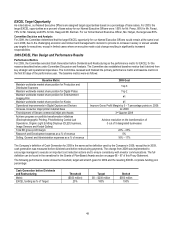
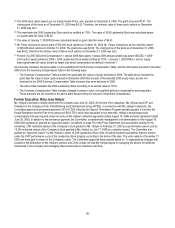
2009 EXCEL Plan Design and Performance Results
Performance Metrics
For 2009, the Committee selected Cash Generation before Dividends and Restructuring as the performance metric for EXCEL for the
reasons described below under Committee Discussion and Analysis. The Committee also established baseline metrics that it derived from
key strategic and operational imperatives. The Committee reviewed and finalized the primary performance metric and baseline metrics in
the first 90 days of the performance year. The baseline metrics were as follows:
Baseline Metric
2009 Goal
Maintain worldwide market share position for Production and
Distributed Scanners
Top 3
Maintain worldwide market share position for Digital Plates
Top 2
Maintain worldwide market share position for Entertainment
Imaging Film
#1
Maintain worldwide market share position for Kiosks
#1
Operational improvements in Digital Capture and Devices
Improve Gross Profit Margin by 3 – 7 percentage points vs. 2008
Increase consumer inkjet printer installed base
2x 2008
First shipment of Stream commercial inkjet print heads
3rd Quarter 2009
Achieve progress on portfolio transformation initiatives
(Electrophotographic Printing, Photofinishing Central Lab
Operations, Organic Light Emitting Displays (OLED) business,
Image Sensors and Kodak Gallery)
Achieve resolution on the transformation of
3 out of 5 designated businesses
Total EK gross profit margin
22% – 23%
Research and Development expense as a % of revenue
5%
Selling, General and Administration expenses as a % of revenue
16% – 17%
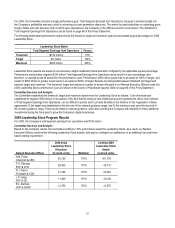
The Company’s definition of Cash Generation for 2009 is the same as the definition used by the Company in 2008, except that in 2009,
cash generation was measured before dividends and before restructuring payments. The change from 2008 was implemented to
encourage managers to execute on important cost reduction actions and to ensure consistency with investor communications. The full
definition can be found in the narratives for the Grants of Plan-Based Awards section on pages 66 – 67 of this Proxy Statement.
The following performance matrix shows the threshold, target and stretch goals for 2009 and the resulting EXCEL corporate funding pool
percentage:
Cash Generation before Dividends
and Restructuring
Threshold
Target
Stretch
Metric
($350 million)
$0 – $200 million
$350 million
EXCEL funding as % of Target
20%
100%
190%