Kodak 2009 Annual Report Download - page 210
Download and view the complete annual report
Please find page 210 of the 2009 Kodak annual report below. You can navigate through the pages in the report by either clicking on the pages listed below, or by using the keyword search tool below to find specific information within the annual report.-
 1
1 -
2
-
3
-
4
-
5
-
6
-
7
-
8
-
9
-
10
-
11
-
12
-
13
-
14
-
15
-
16
-
17
-
18
-
19
-
20
-
21
-
22
-
23
-
24
-
25
-
26
-
27
-
28
-
29
-
30
-
31
-
32
-
33
-
34
-
35
-
36
-
37
-
38
-
39
-
40
-
41
-
42
-
43
-
44
-
45
-
46
-
47
-
48
-
49
-
50
-
51
-
52
-
53
-
54
-
55
-
56
-
57
-
58
-
59
-
60
-
61
-
62
-
63
-
64
-
65
-
66
-
67
-
68
-
69
-
70
-
71
-
72
-
73
-
74
-
75
-
76
-
77
-
78
-
79
-
80
-
81
-
82
-
83
-
84
-
85
-
86
-
87
-
88
-
89
-
90
-
91
-
92
-
93
-
94
-
95
-
96
-
97
-
98
-
99
-
100
-
101
-
102
-
103
-
104
-
105
-
106
-
107
-
108
-
109
-
110
-
111
-
112
-
113
-
114
-
115
-
116
-
117
-
118
-
119
-
120
-
121
-
122
-
123
-
124
-
125
-
126
-
127
-
128
-
129
-
130
-
131
-
132
-
133
-
134
-
135
-
136
-
137
-
138
-
139
-
140
-
141
-
142
-
143
-
144
-
145
-
146
-
147
-
148
-
149
-
150
-
151
-
152
-
153
-
154
-
155
-
156
-
157
-
158
-
159
-
160
-
161
-
162
-
163
-
164
-
165
-
166
-
167
-
168
-
169
-
170
-
171
-
172
-
173
-
174
-
175
-
176
-
177
-
178
-
179
-
180
-
181
-
182
-
183
-
184
-
185
-
186
-
187
-
188
-
189
-
190
-
191
-
192
-
193
-
194
-
195
-
196
-
197
-
198
-
199
-
 200
200 -
 201
201 -
 202
202 -
 203
203 -
 204
204 -
 205
205 -
 206
206 -
 207
207 -
 208
208 -
 209
209 -
 210
210 -
 211
211 -
 212
212 -
 213
213 -
 214
214 -
 215
215 -
 216
216 -
 217
217 -
 218
218 -
 219
219 -
 220
220 -
221
-
222
-
223
-
224
-
225
-
226
-
227
-
228
-
229
-
230
-
231
-
232
-
233
-
234
-
235
-
236
-
237
-
238
-
239
-
240
-
241
-
242
-
243
-
244
-
245
-
246
-
247
-
248
-
249
-
250
-
251
-
252
-
253
-
254
-
255
-
256
-
257
-
258
-
259
-
260
-
261
-
262
-
263
-
264
 |
 |

66
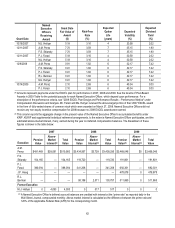
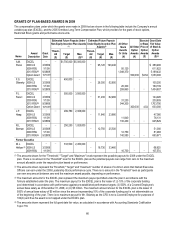
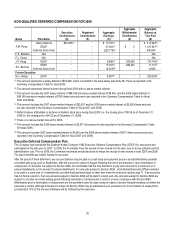
GRANTS OF PLAN-BASED AWARDS IN 2009
The compensation plans under which the grants were made in 2009 that are shown in the following table include the Company’s annual
variable pay plan (EXCEL), and the 2005 Omnibus Long-Term Compensation Plan, which provides for the grant of stock options,
Restricted Stock grants and performance stock units.
Estimated Future Payouts Under
Non-Equity Incentive Plan Awards
(1)
Estimated Future Payouts
Under Equity Incentive Plan
Awards(2)
Name
Award
Description
Grant
Date
Thresh-
old
($)
Target
($)
Max.
($)(3)
Thresh-
old
(#)
Target
(#)
Max.
(#)
All Other
Stock
Awards
Or Units
(#)
All Other
Option
Awards
(#)
Exercise
or Base
Price of
Option
Awards
($)
Grant Date
Fair Value
of Stock &
Option
Awards
($)(4)
A.M.
Perez
EXCEL
2009 LS
2009 RSU
2010 RSU(5)
Option Grant
—
3/23/09
1/1/09
9/28/09
10/14/09
—
$1,705,000
$5,000,000
—
95,120
190,240
95,120
1,048,370
500,000
$4.54
$ 380,480
611,622
5,189,432
1,050,000
F.S.
Sklarsky
EXCEL
2009 LS
2009 RSU
2010 RSU(5)
—
3/23/09
1/1/09
9/28/09
—
450,000
—
—
26,300
52,600
26,300
289,860
—
—
105,200
169,109
1,434,807
P.J.
Faraci
EXCEL
2009 LS
2009 RSU
2010 RSU(5)
Option Grant
—
3/23/09
1/1/09
9/28/09
10/14/09
—
595,000
3,500,000
—
31,230
62,460
31,230
344,200
300,000
4.54
124,920
200,809
1,703,790
630,000
J.P.
Haag
EXCEL
2009 LS
2009 RSU
2010 RSU(5)
—
3/23/09
1/1/09
9/28/09
—
299,780
2,306,000
—
11,840
23,680
11,840
130,430
—
—
47,360
76,131
645,629
R.L.
Berman
EXCEL
2009 LS
2009 RSU
2010 RSU(5)
—
3/23/09
1/1/09
9/28/09
—
250,250
1,925,000
—
12,750
25,500
12,750
140,580
—
—
51,000
81,983
695,871
Former Executive
M. J.
Hellyar (6)
EXCEL
2009 LS
2009 RSU
—
3/23/09
1/1/09
—
318,500
2,450,000
—
16,730
33,460
16,730
—
—
66,920
107,574
(1) The amounts shown for the "Threshold," "Target" and "Maximum" levels represent the possible payouts for 2009 under the EXCEL
plan. There is no amount in the "threshold" level for the EXCEL plan as the potential payouts can range from zero to the maximum
amount allowable under the respective plan based on performance.
(2) The amounts shown represent the "threshold," "target" and "maximum" number of shares of common stock that Named Executive
Officers can earn under the 2009 Leadership Stock performance cycle. There is no amount in the "threshold" level as participants
can earn any amount between zero and the maximum award payable, depending on performance.
(3) The maximum amounts for the EXCEL plan represent the maximum payout permitted under the plan in accordance with the
formula established under the plan. The maximum payout for the EXCEL plan is the lesser of: (i) 10% of the corporate funding
pool determined in accordance with performance against pre-established performance targets; (ii) 500% of a Covered Employee’s
annual base salary as of December 31, 2008; or (iii) $5 million. The maximum amount shown for the EXCEL plan is the lesser of
500% of annual base salary of $5 million since the amount representing 10% of the corporate funding pool is not determinable as
of the beginning of the year. There is no maximum payout for Mr. Sklarsky as the CFO is not a Covered Employee for purposes of
162(m) and thus his award is not capped under the EXCEL plan.
(4) The amounts shown represent the full grant date fair value, as calculated in accordance with Accounting Standards Codification
Topic 718.