Kodak 2009 Annual Report Download - page 190
Download and view the complete annual report
Please find page 190 of the 2009 Kodak annual report below. You can navigate through the pages in the report by either clicking on the pages listed below, or by using the keyword search tool below to find specific information within the annual report.-
 1
1 -
2
-
3
-
4
-
5
-
6
-
7
-
8
-
9
-
10
-
11
-
12
-
13
-
14
-
15
-
16
-
17
-
18
-
19
-
20
-
21
-
22
-
23
-
24
-
25
-
26
-
27
-
28
-
29
-
30
-
31
-
32
-
33
-
34
-
35
-
36
-
37
-
38
-
39
-
40
-
41
-
42
-
43
-
44
-
45
-
46
-
47
-
48
-
49
-
50
-
51
-
52
-
53
-
54
-
55
-
56
-
57
-
58
-
59
-
60
-
61
-
62
-
63
-
64
-
65
-
66
-
67
-
68
-
69
-
70
-
71
-
72
-
73
-
74
-
75
-
76
-
77
-
78
-
79
-
80
-
81
-
82
-
83
-
84
-
85
-
86
-
87
-
88
-
89
-
90
-
91
-
92
-
93
-
94
-
95
-
96
-
97
-
98
-
99
-
100
-
101
-
102
-
103
-
104
-
105
-
106
-
107
-
108
-
109
-
110
-
111
-
112
-
113
-
114
-
115
-
116
-
117
-
118
-
119
-
120
-
121
-
122
-
123
-
124
-
125
-
126
-
127
-
128
-
129
-
130
-
131
-
132
-
133
-
134
-
135
-
136
-
137
-
138
-
139
-
140
-
141
-
142
-
143
-
144
-
145
-
146
-
147
-
148
-
149
-
150
-
151
-
152
-
153
-
154
-
155
-
156
-
157
-
158
-
159
-
160
-
161
-
162
-
163
-
164
-
165
-
166
-
167
-
168
-
169
-
170
-
171
-
172
-
173
-
174
-
175
-
176
-
177
-
178
-
179
-
 180
180 -
 181
181 -
 182
182 -
 183
183 -
 184
184 -
 185
185 -
 186
186 -
 187
187 -
 188
188 -
 189
189 -
 190
190 -
 191
191 -
 192
192 -
 193
193 -
 194
194 -
 195
195 -
 196
196 -
 197
197 -
 198
198 -
 199
199 -
 200
200 -
201
-
202
-
203
-
204
-
205
-
206
-
207
-
208
-
209
-
210
-
211
-
212
-
213
-
214
-
215
-
216
-
217
-
218
-
219
-
220
-
221
-
222
-
223
-
224
-
225
-
226
-
227
-
228
-
229
-
230
-
231
-
232
-
233
-
234
-
235
-
236
-
237
-
238
-
239
-
240
-
241
-
242
-
243
-
244
-
245
-
246
-
247
-
248
-
249
-
250
-
251
-
252
-
253
-
254
-
255
-
256
-
257
-
258
-
259
-
260
-
261
-
262
-
263
-
264
 |
 |
46
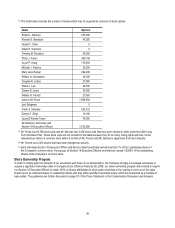
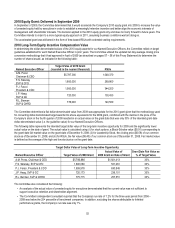
Use of Tally Sheets
The Committee annually reviews all components of each Named Executive Officer’s compensation as presented in a set of Tally Sheets
that are prepared by the Committee’s independent consultant. The Tally Sheets provide a comprehensive view of each Named Executive
Officer’s compensation, broken down into three components:
1) An estimate of projected annual compensation, including target total cash compensation, the total estimated value of annual
long-term equity awards and the value of benefits and perquisites received by each Named Executive Officer;
2) A comprehensive summary of the vested and unvested values of all outstanding equity awards held by each Named Executive
Officer at current and assumed future stock prices; and
3) A summary of the severance benefits potentially payable to each Named Executive Officer as of year-end under various
termination scenarios.
The Tally Sheets provide the Committee with context for the decisions it makes in relation to total direct compensation. The Tally Sheets
allow the Committee to holistically assess total direct compensation and the relationship of its various components to each other. The Tally
Sheets also enable the Committee to determine the extent to which wealth creation exists through equity-based compensation and to
assess the strength of retention power as a result of unvested value. The Tally Sheets may also influence the Committee’s views on a
variety of other issues, such as changes to severance plans and employment agreements, special equity grants to promote retention or
changes in long-term equity incentives.
Committee Discussion and Analysis of Retention Risks
From the 2008 Tally Sheets, the Committee found that the total outstanding equity held by our Named Executive Officers had little intrinsic
(i.e. “in-the-money”) value and thereby did not sufficiently mitigate the retention risk for these executives, even in the event of significant
stock price appreciation. The Committee considered this factor in making its equity grant mix decisions for 2009 in December 2008 and in
its decision to accelerate the issuance, and extend the vesting requirements, of the 2010 equity grant as described further on pages 52 –
53 of this Proxy Statement.
From the 2009 Tally Sheets, the Committee concluded that the 2009 and accelerated 2010 grants meaningfully addressed the retention
concern identified in 2008 by increasing the value of unvested equity to a level that was economically meaningful for each executive,
thereby creating a stronger retentive influence and fostering alignment between management and shareholder interests as reflected in
changes in share price. As a result, the Committee intends to return to a more typical equity approach in 2011, assuming business
conditions warrant doing so.
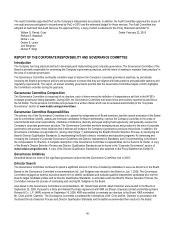
Use of the CEO Evaluation Process
The Presiding Director and the Chair of the Compensation Committee, with support from Mr. Berman, our CHRO, lead the annual CEO
evaluation process to assess the performance of our CEO. Each February, our CEO completes a written self-assessment of his
performance against the business plan of record for the prior year. This written assessment is sent to the full Board for review. Later in the
same month, the CHRO interviews each member of the Board to collect feedback against an established set of criteria, including reaction
to our CEO self-assessment and the Company’s leadership imperatives, which are: 1) “Drives to Win;” 2) “Develops Leaders;” and 3)
“Leads With Values.” The CHRO summarizes the input of each Board member for review with the Presiding Director and the Chair of the
Committee. The Presiding Director and the Chair of the Committee discuss the summary with the Board and subsequently review the
feedback with our CEO. Since the same director currently is both the Presiding Director and Chair of the Committee, the Chair of the
Finance Committee of the Board served as co-leader of this process for 2009.
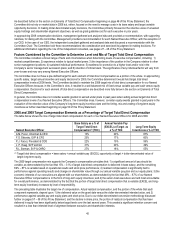
ELEMENTS OF TOTAL DIRECT COMPENSATION
Total direct compensation consists of the following elements: base salary, annual variable pay and long-term equity incentives.
Base Salaries
Base salaries provide a regular source of income to our Named Executive Officers. Consistent with our philosophy of tying pay to
performance, our Named Executive Officers receive a relatively small proportion of overall total direct compensation in the form of base
salary.
The Committee reviews base salaries annually, but it does not automatically increase salaries. Rather, base salaries are adjusted only if,
and as, the Committee deems appropriate, utilizing market median data as a reference and in consideration of: 1) experience; 2)
responsibilities; 3) the importance of the position relative to other senior management positions within the Company; 4) external relative
scope or changes in the competitive marketplace; and 5) years since last base salary change. Any change in base salary will affect an
executive’s target opportunity under our annual variable pay plan, which is based on a percentage of base salary.
The market median is targeted because it:
• Enables us to attract and retain high quality talent;