Kodak 2009 Annual Report Download - page 33
Download and view the complete annual report
Please find page 33 of the 2009 Kodak annual report below. You can navigate through the pages in the report by either clicking on the pages listed below, or by using the keyword search tool below to find specific information within the annual report.-
 1
1 -
2
-
3
-
4
-
5
-
6
-
7
-
8
-
9
-
10
-
11
-
12
-
13
-
14
-
15
-
16
-
17
-
18
-
19
-
20
-
21
-
22
-
 23
23 -
 24
24 -
 25
25 -
 26
26 -
 27
27 -
 28
28 -
 29
29 -
 30
30 -
 31
31 -
 32
32 -
 33
33 -
 34
34 -
 35
35 -
 36
36 -
 37
37 -
 38
38 -
 39
39 -
 40
40 -
 41
41 -
 42
42 -
 43
43 -
44
-
45
-
46
-
47
-
48
-
49
-
50
-
51
-
52
-
53
-
54
-
55
-
56
-
57
-
58
-
59
-
60
-
61
-
62
-
63
-
64
-
65
-
66
-
67
-
68
-
69
-
70
-
71
-
72
-
73
-
74
-
75
-
76
-
77
-
78
-
79
-
80
-
81
-
82
-
83
-
84
-
85
-
86
-
87
-
88
-
89
-
90
-
91
-
92
-
93
-
94
-
95
-
96
-
97
-
98
-
99
-
100
-
101
-
102
-
103
-
104
-
105
-
106
-
107
-
108
-
109
-
110
-
111
-
112
-
113
-
114
-
115
-
116
-
117
-
118
-
119
-
120
-
121
-
122
-
123
-
124
-
125
-
126
-
127
-
128
-
129
-
130
-
131
-
132
-
133
-
134
-
135
-
136
-
137
-
138
-
139
-
140
-
141
-
142
-
143
-
144
-
145
-
146
-
147
-
148
-
149
-
150
-
151
-
152
-
153
-
154
-
155
-
156
-
157
-
158
-
159
-
160
-
161
-
162
-
163
-
164
-
165
-
166
-
167
-
168
-
169
-
170
-
171
-
172
-
173
-
174
-
175
-
176
-
177
-
178
-
179
-
180
-
181
-
182
-
183
-
184
-
185
-
186
-
187
-
188
-
189
-
190
-
191
-
192
-
193
-
194
-
195
-
196
-
197
-
198
-
199
-
200
-
201
-
202
-
203
-
204
-
205
-
206
-
207
-
208
-
209
-
210
-
211
-
212
-
213
-
214
-
215
-
216
-
217
-
218
-
219
-
220
-
221
-
222
-
223
-
224
-
225
-
226
-
227
-
228
-
229
-
230
-
231
-
232
-
233
-
234
-
235
-
236
-
237
-
238
-
239
-
240
-
241
-
242
-
243
-
244
-
245
-
246
-
247
-
248
-
249
-
250
-
251
-
252
-
253
-
254
-
255
-
256
-
257
-
258
-
259
-
260
-
261
-
262
-
263
-
264
 |
 |

31
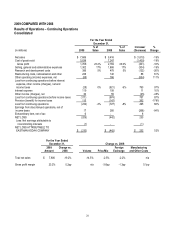
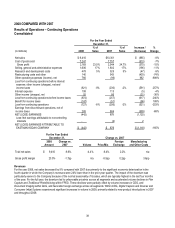
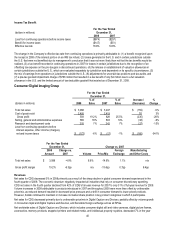
2009 COMPARED WITH 2008
Results of Operations – Continuing Operations
Consolidated
For the Year Ended
December 31,
(in millions) 2009
% of
Sales 2008
% of
Sales
Increase/
(Decrease)
%
Change
Net sales $ 7,606 $ 9,416 $ (1,810) -19%
Cost of goods sold 5,838 7,247 (1,409) -19%
Gross profit 1,768 23.2% 2,169 23.0% (401) -18%
Selling, general and administrative expenses 1,302 17% 1,606 17% (304) -19%
Research and development costs 356 5% 478 5% (122) -26%
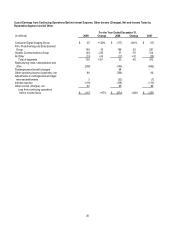
Restructuring costs, rationalization and other 226 140 86 61%
Other operating (income) expenses, net (88) 766 (854) 111%
Loss from continuing operations before interest
expense, other income (charges), net and
income taxes (28) 0% (821) -9% 793 97%
Interest expense 119 108 11 10%
Other income (charges), net 30 55 (25) -45%
Loss from continuing operations before income taxes (117) (874) 757 87%
Provision (benefit) for income taxes 115 (147) 262 -178%
Loss from continuing operations (232) -3% (727) -8% 495 68%
Earnings from discontinued operations, net of
income taxes 17 285 (268) -94%
Extraordinary item, net of tax 6 - 6
NET LOSS (209) (442) 233
Less: Net earnings attributable to
noncontrolling interests (1) - (1)
NET LOSS ATTRIBUTABLE TO
EASTMAN KODAK COMPANY $ (210) $ (442) $ 232 52%
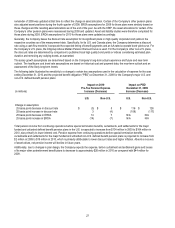
For the Year Ended
December 31, Change vs. 2008
2009
Amount
Change vs.
2008 Volume Price/Mix
Foreign
Exchange
Manufacturing
and Other Costs
Total net sales $ 7,606 -19.2% -14.5% -2.5% -2.2% n/a
Gross profit margin 23.2% 0.2pp n/a -3.6pp -1.3pp 5.1pp