Kodak 2009 Annual Report Download - page 48
Download and view the complete annual report
Please find page 48 of the 2009 Kodak annual report below. You can navigate through the pages in the report by either clicking on the pages listed below, or by using the keyword search tool below to find specific information within the annual report.-
 1
1 -
2
-
3
-
4
-
5
-
6
-
7
-
8
-
9
-
10
-
11
-
12
-
13
-
14
-
15
-
16
-
17
-
18
-
19
-
20
-
21
-
22
-
23
-
24
-
25
-
26
-
27
-
28
-
29
-
30
-
31
-
32
-
33
-
34
-
35
-
36
-
37
-
 38
38 -
 39
39 -
 40
40 -
 41
41 -
 42
42 -
 43
43 -
 44
44 -
 45
45 -
 46
46 -
 47
47 -
 48
48 -
 49
49 -
 50
50 -
 51
51 -
 52
52 -
 53
53 -
 54
54 -
 55
55 -
 56
56 -
 57
57 -
 58
58 -
59
-
60
-
61
-
62
-
63
-
64
-
65
-
66
-
67
-
68
-
69
-
70
-
71
-
72
-
73
-
74
-
75
-
76
-
77
-
78
-
79
-
80
-
81
-
82
-
83
-
84
-
85
-
86
-
87
-
88
-
89
-
90
-
91
-
92
-
93
-
94
-
95
-
96
-
97
-
98
-
99
-
100
-
101
-
102
-
103
-
104
-
105
-
106
-
107
-
108
-
109
-
110
-
111
-
112
-
113
-
114
-
115
-
116
-
117
-
118
-
119
-
120
-
121
-
122
-
123
-
124
-
125
-
126
-
127
-
128
-
129
-
130
-
131
-
132
-
133
-
134
-
135
-
136
-
137
-
138
-
139
-
140
-
141
-
142
-
143
-
144
-
145
-
146
-
147
-
148
-
149
-
150
-
151
-
152
-
153
-
154
-
155
-
156
-
157
-
158
-
159
-
160
-
161
-
162
-
163
-
164
-
165
-
166
-
167
-
168
-
169
-
170
-
171
-
172
-
173
-
174
-
175
-
176
-
177
-
178
-
179
-
180
-
181
-
182
-
183
-
184
-
185
-
186
-
187
-
188
-
189
-
190
-
191
-
192
-
193
-
194
-
195
-
196
-
197
-
198
-
199
-
200
-
201
-
202
-
203
-
204
-
205
-
206
-
207
-
208
-
209
-
210
-
211
-
212
-
213
-
214
-
215
-
216
-
217
-
218
-
219
-
220
-
221
-
222
-
223
-
224
-
225
-
226
-
227
-
228
-
229
-
230
-
231
-
232
-
233
-
234
-
235
-
236
-
237
-
238
-
239
-
240
-
241
-
242
-
243
-
244
-
245
-
246
-
247
-
248
-
249
-
250
-
251
-
252
-
253
-
254
-
255
-
256
-
257
-
258
-
259
-
260
-
261
-
262
-
263
-
264
 |
 |

46
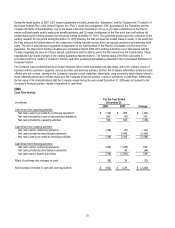
Liquidity and Capital Resources
2009
Cash Flow Activity
For the Year Ended
(in millions) December 31,
2009 2008 Change
Cash flows from operating activities:
Net cash used in continuing operations $ (136) $ (128) $ (8)
Net cash provided by discontinued operations - 296 (296)
Net cash (used in) provided by operating activities (136) 168 (304)
Cash flows from investing activities:
Net cash used in continuing operations (22) (188) 166
Net cash provided by discontinued operations - - -
Net cash used in investing activities (22) (188) 166
Cash flows from financing activities:
Net cash provided by (used in) continuing operations 33 (746) 779
Net cash provided by discontinued operations - - -
Net cash provided by (used in) financing activities 33 (746) 779
Effect of exchange rate changes on cash 4 (36) 40
Net decrease in cash and cash equivalents $ (121) $ (802) $ 681
Operating Activities
Net cash used in continuing operations from operating activities increased $8 million for the year ended December 31, 2009 as
compared with the prior year. Cash received in 2009 related to non-recurring licensing agreements, net of applicable withholding
taxes, of $622 million, was $472 million higher than cash received in 2008 related to a non-recurring licensing agreement of $150
million. Additionally, cash expended in 2008 for 2007 bonus programs of $95 million had no comparable amount paid in 2009 for
2008 bonus programs. These benefits to cash flows from operating activities for 2009 were partially offset by the receipt of the
interest portion of an IRS tax refund in 2008 of $275 million, with no comparable receipt in 2009. The combination of these and other
factors led to the use of cash in operating activities of $136 million in 2009, as compared with cash used on the same basis of $128
million in 2008. Net cash provided by discontinued operations decreased $296 million in 2009 as compared with 2008 due primarily
to the receipt of the refund of past federal income taxes referred to above.
Investing Activities
Net cash used in investing activities decreased $166 million for the year ended December 31, 2009 as compared with 2008 due
primarily to a decline of $102 million in additions to properties and increased cash proceeds received from sales of assets and
businesses of $64 million, primarily from the sale of assets of the Company’s OLED group.
Financing Activities
Net cash provided by financing activities increased $779 million for the year ended December 31, 2009 as compared with 2008 due
primarily to approximately $650 million of net proceeds from two new debt issuances in 2009, of which $563 million was used to
repurchase 2033 Convertible Senior Notes. Also, scheduled debt repayments in 2008 were $250 million higher than in 2009, share
repurchases were $301 million in 2008, for which there were no comparable payments in 2009, and dividend payments were $139
million in 2008, for which there were no comparable payments in 2009.