Kodak 2009 Annual Report Download - page 205
Download and view the complete annual report
Please find page 205 of the 2009 Kodak annual report below. You can navigate through the pages in the report by either clicking on the pages listed below, or by using the keyword search tool below to find specific information within the annual report.-
 1
1 -
2
-
3
-
4
-
5
-
6
-
7
-
8
-
9
-
10
-
11
-
12
-
13
-
14
-
15
-
16
-
17
-
18
-
19
-
20
-
21
-
22
-
23
-
24
-
25
-
26
-
27
-
28
-
29
-
30
-
31
-
32
-
33
-
34
-
35
-
36
-
37
-
38
-
39
-
40
-
41
-
42
-
43
-
44
-
45
-
46
-
47
-
48
-
49
-
50
-
51
-
52
-
53
-
54
-
55
-
56
-
57
-
58
-
59
-
60
-
61
-
62
-
63
-
64
-
65
-
66
-
67
-
68
-
69
-
70
-
71
-
72
-
73
-
74
-
75
-
76
-
77
-
78
-
79
-
80
-
81
-
82
-
83
-
84
-
85
-
86
-
87
-
88
-
89
-
90
-
91
-
92
-
93
-
94
-
95
-
96
-
97
-
98
-
99
-
100
-
101
-
102
-
103
-
104
-
105
-
106
-
107
-
108
-
109
-
110
-
111
-
112
-
113
-
114
-
115
-
116
-
117
-
118
-
119
-
120
-
121
-
122
-
123
-
124
-
125
-
126
-
127
-
128
-
129
-
130
-
131
-
132
-
133
-
134
-
135
-
136
-
137
-
138
-
139
-
140
-
141
-
142
-
143
-
144
-
145
-
146
-
147
-
148
-
149
-
150
-
151
-
152
-
153
-
154
-
155
-
156
-
157
-
158
-
159
-
160
-
161
-
162
-
163
-
164
-
165
-
166
-
167
-
168
-
169
-
170
-
171
-
172
-
173
-
174
-
175
-
176
-
177
-
178
-
179
-
180
-
181
-
182
-
183
-
184
-
185
-
186
-
187
-
188
-
189
-
190
-
191
-
192
-
193
-
194
-
 195
195 -
 196
196 -
 197
197 -
 198
198 -
 199
199 -
 200
200 -
 201
201 -
 202
202 -
 203
203 -
 204
204 -
 205
205 -
 206
206 -
 207
207 -
 208
208 -
 209
209 -
 210
210 -
 211
211 -
 212
212 -
 213
213 -
 214
214 -
 215
215 -
216
-
217
-
218
-
219
-
220
-
221
-
222
-
223
-
224
-
225
-
226
-
227
-
228
-
229
-
230
-
231
-
232
-
233
-
234
-
235
-
236
-
237
-
238
-
239
-
240
-
241
-
242
-
243
-
244
-
245
-
246
-
247
-
248
-
249
-
250
-
251
-
252
-
253
-
254
-
255
-
256
-
257
-
258
-
259
-
260
-
261
-
262
-
263
-
264
 |
 |

61
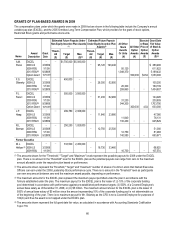
COMPENSATION OF NAMED EXECUTIVE OFFICERS
SUMMARY COMPENSATION TABLE
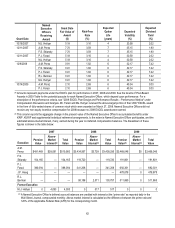
The table below summarizes the total compensation of each of our Named Executive Officers for 2007, 2008, and 2009:
Name and
Principal
Position
Year
Salary(1)
Bonus
Stock
Awards(2)
Option
Awards(3)
Non-Equity
Incentive Plan
Comp.(4)
Change in
Pension
Value and
Non-qualified
Deferred
Comp.
Earnings(5)
All Other
Comp.(6)
Total
2009
$ 988,660
—
$6,181,534
$1,050,000
$1,705,000
$2,468,046
$232,079
$12,625,319
2008
1,096,168
—
2,321,282
683,901
0
3,438,295
285,442
7,825,088
A.M. Perez
Chairman &
CEO
2007
1,096,168
—
3,287,295
3,060,442
3,324,750
519,560
377,865
11,666,080
2009
558,811
—
1,709,116
—
450,000
191,801
773
2,910, 501
2008
597,911
—
641,885
189,098
0
119,720
10,369
1,558,983
F.S. Sklarsky
EVP & CFO
2007
597,911
—
825,600
846,153
900,000
104,165
37,504
3,311,333
2009
651,950
—
2,029,519
630,000
595,000
692,301
748
4,599,518
2008
697,561
—
1,300,992
224,543
0
341,208
27,947
2,592,251
P.J. Faraci
President &
COO
2007
606,879
—
615,105
675,938
1,066,158
386,094
31,362
3,381,536
J.P. Haag
SVP & GC
2009
429,537
—
769,120
—
299,780
478,878
6,693
1,984,008
2009
358,566
—
828,854
—
250,250
511,865
5,539
1,955,074
R.L. Berman
SVP &
CHRO
2008
383,658
—
311,210
91,673
0
100,757
6,117
893,415
Former Executive
2009
336,734
—
217,662(7)
—
159,250
—
1,618,924
2,332,570
2008
488,293
—
742,496
120,302
0
517
10,904
1,362,512
M.J. Hellyar
Former EVP
2007
488,293
—
615,153
465,786
637,980
4,093
2,653
2,213,958
(1) This column reports base salary earned by each of our Named Executive Officers. See pages 46 – 47 of this Proxy Statement for
a discussion and analysis of base salary levels.
(2) This column reports the grant date fair value (as calculated for financial reporting purposes), without any reduction for risk of
forfeiture, for all stock awards (including Leadership Stock, Restricted Stock and RSUs) granted during each year reported. The
2009 Leadership Stock awards are included in the above table assuming the target allocation; the maximum number of stock units
that may have been earned for this award was equal to 200% of the target allocation, which is equivalent to the following values
for each Named Executive Officer (based on the grant date fair value of $4.00): $760,960 for A.M. Perez; $210,400 for F.S.
Sklarsky; $249,840 for P.J. Faraci; $94,720 for J.P. Haag; $102,000 for R.L. Berman; and $133,840 for M.J. Hellyar.
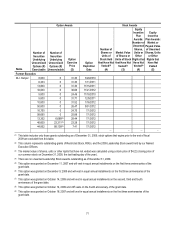
(3) This column reports the grant date fair value (as calculated for financial reporting purposes), without any reduction for risk of
forfeiture, for all stock option awards granted during each year reported. The assumptions used to calculate the values of the
awards are the same as those used for our stock-based compensation disclosure in Note 20 to our financial statements in our
Annual Report on Form 10-K for the year ended December 31, 2009, as filed with the SEC on February 22, 2010. The following
table includes the assumptions used to calculate the grant date fair values of stock options granted in 2007, 2008 and 2009.