Kodak 2009 Annual Report Download - page 67
Download and view the complete annual report
Please find page 67 of the 2009 Kodak annual report below. You can navigate through the pages in the report by either clicking on the pages listed below, or by using the keyword search tool below to find specific information within the annual report.-
 1
1 -
2
-
3
-
4
-
5
-
6
-
7
-
8
-
9
-
10
-
11
-
12
-
13
-
14
-
15
-
16
-
17
-
18
-
19
-
20
-
21
-
22
-
23
-
24
-
25
-
26
-
27
-
28
-
29
-
30
-
31
-
32
-
33
-
34
-
35
-
36
-
37
-
38
-
39
-
40
-
41
-
42
-
43
-
44
-
45
-
46
-
47
-
48
-
49
-
50
-
51
-
52
-
53
-
54
-
55
-
56
-
 57
57 -
 58
58 -
 59
59 -
 60
60 -
 61
61 -
 62
62 -
 63
63 -
 64
64 -
 65
65 -
 66
66 -
 67
67 -
 68
68 -
 69
69 -
 70
70 -
 71
71 -
 72
72 -
 73
73 -
 74
74 -
 75
75 -
 76
76 -
 77
77 -
78
-
79
-
80
-
81
-
82
-
83
-
84
-
85
-
86
-
87
-
88
-
89
-
90
-
91
-
92
-
93
-
94
-
95
-
96
-
97
-
98
-
99
-
100
-
101
-
102
-
103
-
104
-
105
-
106
-
107
-
108
-
109
-
110
-
111
-
112
-
113
-
114
-
115
-
116
-
117
-
118
-
119
-
120
-
121
-
122
-
123
-
124
-
125
-
126
-
127
-
128
-
129
-
130
-
131
-
132
-
133
-
134
-
135
-
136
-
137
-
138
-
139
-
140
-
141
-
142
-
143
-
144
-
145
-
146
-
147
-
148
-
149
-
150
-
151
-
152
-
153
-
154
-
155
-
156
-
157
-
158
-
159
-
160
-
161
-
162
-
163
-
164
-
165
-
166
-
167
-
168
-
169
-
170
-
171
-
172
-
173
-
174
-
175
-
176
-
177
-
178
-
179
-
180
-
181
-
182
-
183
-
184
-
185
-
186
-
187
-
188
-
189
-
190
-
191
-
192
-
193
-
194
-
195
-
196
-
197
-
198
-
199
-
200
-
201
-
202
-
203
-
204
-
205
-
206
-
207
-
208
-
209
-
210
-
211
-
212
-
213
-
214
-
215
-
216
-
217
-
218
-
219
-
220
-
221
-
222
-
223
-
224
-
225
-
226
-
227
-
228
-
229
-
230
-
231
-
232
-
233
-
234
-
235
-
236
-
237
-
238
-
239
-
240
-
241
-
242
-
243
-
244
-
245
-
246
-
247
-
248
-
249
-
250
-
251
-
252
-
253
-
254
-
255
-
256
-
257
-
258
-
259
-
260
-
261
-
262
-
263
-
264
 |
 |
65
Incremental direct costs (i.e. costs that vary with and are directly related to the acquisition of a contract which would not have been
incurred but for the acquisition of the contract) of a customer contract in a transaction that results in the deferral of revenue are
deferred and netted against revenue in proportion to the related revenue recognized in each period if: (1) an enforceable contract for
the remaining deliverable items exists; and (2) delivery of the remaining items in the arrangement is expected to generate positive
margins allowing realization of the deferred costs. Otherwise, these costs are expensed as incurred and included in cost of goods
sold in the accompanying Consolidated Statement of Operations.
Research and Development Costs
Research and development (“R&D”) costs, which include costs in connection with new product development, fundamental and
exploratory research, process improvement, product use technology and product accreditation, are expensed in the period in which
they are incurred. In connection with business combinations entered into prior to January 1, 2009, the purchase price allocated to
research and development projects that had not yet reached technological feasibility and for which no alternative future use existed
was expensed in the period of acquisition. Effective January 1, 2009, the acquisition-date fair value of research and development
assets acquired in a business combination are capitalized.
Advertising
Advertising costs are expensed as incurred and included in selling, general and administrative expenses in the accompanying
Consolidated Statement of Operations. Advertising expenses amounted to $271 million, $350 million, and $394 million for the years
ended December 31, 2009, 2008, and 2007, respectively.
Shipping and Handling Costs
Amounts charged to customers and costs incurred by the Company related to shipping and handling are included in net sales and
cost of goods sold, respectively.
Impairment of Long-Lived Assets
The Company reviews the carrying values of its long-lived assets, other than goodwill and purchased intangible assets with indefinite
useful lives, for impairment whenever events or changes in circumstances indicate that the carrying values may not be recoverable.
The Company assesses the recoverability of the carrying values of long-lived assets by first grouping its long-lived assets with other
assets and liabilities at the lowest level for which identifiable cash flows are largely independent of the cash flows of other assets and
liabilities (the asset group) and, secondly, by estimating the undiscounted future cash flows that are directly associated with and that
are expected to arise from the use of and eventual disposition of such asset group. The Company estimates the undiscounted cash
flows over the remaining useful life of the primary asset within the asset group. If the carrying value of the asset group exceeds the
estimated undiscounted cash flows, the Company records an impairment charge to the extent the carrying value of the long-lived
asset exceeds its fair value. The Company determines fair value through quoted market prices in active markets or, if quoted market
prices are unavailable, through the performance of internal analyses of discounted cash flows.
In connection with its assessment of recoverability of its long-lived assets and its ongoing strategic review of the business and its
operations, the Company continually reviews the remaining useful lives of its long-lived assets. If this review indicates that the
remaining useful life of the long-lived asset has changed significantly, the Company adjusts the depreciation on that asset to
facilitate full cost recovery over its revised estimated remaining useful life.
Income Taxes
The Company recognizes deferred tax liabilities and assets for the expected future tax consequences of operating losses, credit
carryforwards and temporary differences between the carrying amounts and tax basis of the Company’s assets and liabilities.
Management provides valuation allowances against the net deferred tax asset for amounts that are not considered more likely than
not to be realized. For discussion of the amounts and components of the valuation allowances as of December 31, 2009 and 2008,
see Note 15, “Income Taxes,” in the Notes to Financial Statements.
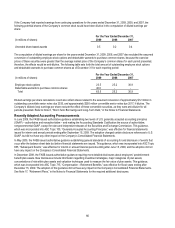
Earnings Per Share
Basic earnings per share computations are based on the weighted-average number of shares of common stock outstanding during
the year. As a result of the net loss from continuing operations presented for the years ended December 31, 2009, 2008, and 2007,
the Company calculated diluted earnings per share using weighted-average basic shares outstanding for each period, as utilizing
diluted shares would be anti-dilutive to loss per share. Weighted-average basic shares outstanding for the years ended December
31, 2009, 2008, and 2007 were 268.0 million, 281.8 million, and 287.7 million shares, respectively.