Kodak 2009 Annual Report Download - page 45
Download and view the complete annual report
Please find page 45 of the 2009 Kodak annual report below. You can navigate through the pages in the report by either clicking on the pages listed below, or by using the keyword search tool below to find specific information within the annual report.-
 1
1 -
2
-
3
-
4
-
5
-
6
-
7
-
8
-
9
-
10
-
11
-
12
-
13
-
14
-
15
-
16
-
17
-
18
-
19
-
20
-
21
-
22
-
23
-
24
-
25
-
26
-
27
-
28
-
29
-
30
-
31
-
32
-
33
-
34
-
 35
35 -
 36
36 -
 37
37 -
 38
38 -
 39
39 -
 40
40 -
 41
41 -
 42
42 -
 43
43 -
 44
44 -
 45
45 -
 46
46 -
 47
47 -
 48
48 -
 49
49 -
 50
50 -
 51
51 -
 52
52 -
 53
53 -
 54
54 -
 55
55 -
56
-
57
-
58
-
59
-
60
-
61
-
62
-
63
-
64
-
65
-
66
-
67
-
68
-
69
-
70
-
71
-
72
-
73
-
74
-
75
-
76
-
77
-
78
-
79
-
80
-
81
-
82
-
83
-
84
-
85
-
86
-
87
-
88
-
89
-
90
-
91
-
92
-
93
-
94
-
95
-
96
-
97
-
98
-
99
-
100
-
101
-
102
-
103
-
104
-
105
-
106
-
107
-
108
-
109
-
110
-
111
-
112
-
113
-
114
-
115
-
116
-
117
-
118
-
119
-
120
-
121
-
122
-
123
-
124
-
125
-
126
-
127
-
128
-
129
-
130
-
131
-
132
-
133
-
134
-
135
-
136
-
137
-
138
-
139
-
140
-
141
-
142
-
143
-
144
-
145
-
146
-
147
-
148
-
149
-
150
-
151
-
152
-
153
-
154
-
155
-
156
-
157
-
158
-
159
-
160
-
161
-
162
-
163
-
164
-
165
-
166
-
167
-
168
-
169
-
170
-
171
-
172
-
173
-
174
-
175
-
176
-
177
-
178
-
179
-
180
-
181
-
182
-
183
-
184
-
185
-
186
-
187
-
188
-
189
-
190
-
191
-
192
-
193
-
194
-
195
-
196
-
197
-
198
-
199
-
200
-
201
-
202
-
203
-
204
-
205
-
206
-
207
-
208
-
209
-
210
-
211
-
212
-
213
-
214
-
215
-
216
-
217
-
218
-
219
-
220
-
221
-
222
-
223
-
224
-
225
-
226
-
227
-
228
-
229
-
230
-
231
-
232
-
233
-
234
-
235
-
236
-
237
-
238
-
239
-
240
-
241
-
242
-
243
-
244
-
245
-
246
-
247
-
248
-
249
-
250
-
251
-
252
-
253
-
254
-
255
-
256
-
257
-
258
-
259
-
260
-
261
-
262
-
263
-
264
 |
 |

43
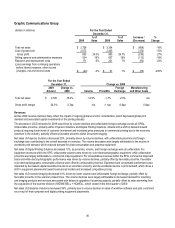
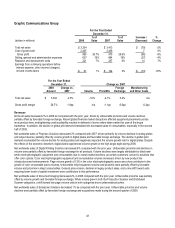
Graphic Communications Group
For the Year Ended
December 31,
(dollars in millions) 2008
% of
Sales 2007
% of
Sales
Increase /
(Decrease)
%
Change
Total net sales $ 3,334 $ 3,413 $ (79) -2%
Cost of goods sold 2,445 2,438 7 0%
Gross profit 889 26.7% 975 28.6% (86) -9%
Selling, general and administrative expenses 637 19% 664 19% (27) -4%
Research and development costs 221 7% 207 6% 14 7%
Earnings from continuing operations before
interest expense, other income (charges),
net and income taxes $ 31 1% $ 104 3% $ (73) -70%
For the Year Ended
December 31, Change vs. 2007
2008
Amount
Change vs.
2007 Volume Price/Mix
Foreign
Exchange
Manufacturing
and Other Costs
Total net sales $ 3,334 -2.3% -1.6% -4.1% 3.4% n/a
Gross profit margin 26.7% -1.9pp n/a -1.1pp -0.6pp -0.2pp
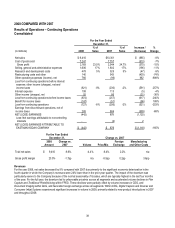
Revenues
GCG net sales decreased 2% in 2008 as compared with the prior year, driven by unfavorable price/mix and volume declines,
partially offset by favorable foreign exchange. Recent global financial market disruptions affected equipment placements across
most product lines, and tightening credit availability resulted in deferrals of some orders taken earlier this year at the drupa
tradeshow. In addition, the decline in global print demand translated into decreased sales of consumables, especially in the second
half of 2008.
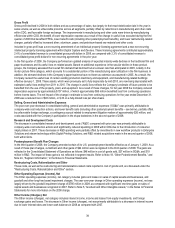
Net worldwide sales of Prepress Solutions decreased 2% compared with 2007, driven primarily by volume declines in analog plates
and output devices, partially offset by volume growth in digital plates and favorable foreign exchange. The decline in global print
demand accelerated the volume decline for analog plates and negatively impacted the volume growth rate for digital plates. Despite
the effects of the economic downturn, digital plates experienced volume growth in the high single digits during 2008.
Net worldwide sales of Digital Printing Solutions decreased 6% compared with the prior year. Unfavorable price/mix and declines in
volume were partially offset by favorable foreign exchange for all products. Volume declines were largely attributable to black-and-
white electrophotographic equipment and consumables due to overall market declines, as certain customers convert to solutions that
offer color options. Color electrophotographic equipment and consumables volumes increased, driven by new product line
introductions and enhancements. Page volume growth of 12% in the color electrophotographic space was a key contributor to the
growth of color consumable sales volumes. Unfavorable inkjet equipment volume and price/mix were partially offset by favorable
volume and price/mix in inkjet consumables. General price erosion, declines in legacy product sales, and a mix shift toward units
requiring lower levels of capital investment were contributors to this performance.
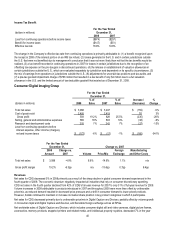
Net worldwide sales of Document Imaging decreased 2% in 2008 compared with the prior year. Unfavorable price/mix was partially
offset by volume growth and favorable foreign exchange. While volume grew in both the Production Scanner and Distributed
Scanner categories, a shift toward low-page volume units in both categories drove unfavorable price/mix.
Net worldwide sales of Enterprise Solutions decreased 1% as compared with the prior year. Unfavorable price/mix and volume
declines were partially offset by favorable foreign exchange and acquisitions made during the second quarter of 2008.