Kodak 2009 Annual Report Download - page 41
Download and view the complete annual report
Please find page 41 of the 2009 Kodak annual report below. You can navigate through the pages in the report by either clicking on the pages listed below, or by using the keyword search tool below to find specific information within the annual report.-
 1
1 -
2
-
3
-
4
-
5
-
6
-
7
-
8
-
9
-
10
-
11
-
12
-
13
-
14
-
15
-
16
-
17
-
18
-
19
-
20
-
21
-
22
-
23
-
24
-
25
-
26
-
27
-
28
-
29
-
30
-
 31
31 -
 32
32 -
 33
33 -
 34
34 -
 35
35 -
 36
36 -
 37
37 -
 38
38 -
 39
39 -
 40
40 -
 41
41 -
 42
42 -
 43
43 -
 44
44 -
 45
45 -
 46
46 -
 47
47 -
 48
48 -
 49
49 -
 50
50 -
 51
51 -
52
-
53
-
54
-
55
-
56
-
57
-
58
-
59
-
60
-
61
-
62
-
63
-
64
-
65
-
66
-
67
-
68
-
69
-
70
-
71
-
72
-
73
-
74
-
75
-
76
-
77
-
78
-
79
-
80
-
81
-
82
-
83
-
84
-
85
-
86
-
87
-
88
-
89
-
90
-
91
-
92
-
93
-
94
-
95
-
96
-
97
-
98
-
99
-
100
-
101
-
102
-
103
-
104
-
105
-
106
-
107
-
108
-
109
-
110
-
111
-
112
-
113
-
114
-
115
-
116
-
117
-
118
-
119
-
120
-
121
-
122
-
123
-
124
-
125
-
126
-
127
-
128
-
129
-
130
-
131
-
132
-
133
-
134
-
135
-
136
-
137
-
138
-
139
-
140
-
141
-
142
-
143
-
144
-
145
-
146
-
147
-
148
-
149
-
150
-
151
-
152
-
153
-
154
-
155
-
156
-
157
-
158
-
159
-
160
-
161
-
162
-
163
-
164
-
165
-
166
-
167
-
168
-
169
-
170
-
171
-
172
-
173
-
174
-
175
-
176
-
177
-
178
-
179
-
180
-
181
-
182
-
183
-
184
-
185
-
186
-
187
-
188
-
189
-
190
-
191
-
192
-
193
-
194
-
195
-
196
-
197
-
198
-
199
-
200
-
201
-
202
-
203
-
204
-
205
-
206
-
207
-
208
-
209
-
210
-
211
-
212
-
213
-
214
-
215
-
216
-
217
-
218
-
219
-
220
-
221
-
222
-
223
-
224
-
225
-
226
-
227
-
228
-
229
-
230
-
231
-
232
-
233
-
234
-
235
-
236
-
237
-
238
-
239
-
240
-
241
-
242
-
243
-
244
-
245
-
246
-
247
-
248
-
249
-
250
-
251
-
252
-
253
-
254
-
255
-
256
-
257
-
258
-
259
-
260
-
261
-
262
-
263
-
264
 |
 |
39
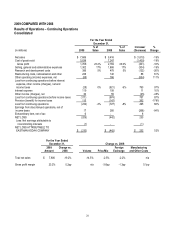
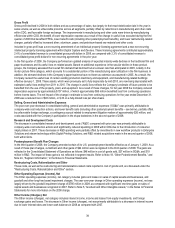
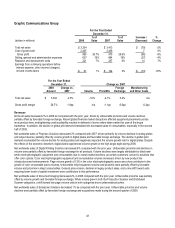
Gross Profit
Gross profit declined in 2008 in both dollars and as a percentage of sales, due largely to the broad deterioration late in the year in
sales volume, as well as unfavorable price/mix across all segments, partially offset by reductions in manufacturing and other costs
within CDG, and favorable foreign exchange. The improvements in manufacturing and other costs were driven by manufacturing
efficiencies within CDG, the benefit of lower depreciation expense as a result of the change in useful lives executed during the first
quarter of 2008 that benefited FPEG, lower benefit costs (including other postemployment benefits), and lower restructuring-related
charges, partially offset by increased silver, aluminum, paper, and petroleum-based raw material and other costs.
Included in gross profit was a non-recurring amendment of an intellectual property licensing agreement and a new non-recurring
intellectual property licensing agreement within Digital Capture and Devices. These licensing agreements contributed approximately
2.4% of consolidated revenue to consolidated gross profit dollars in 2008, as compared with 2.3% of consolidated revenue to
consolidated gross profit dollars for non-recurring agreements in the prior year.
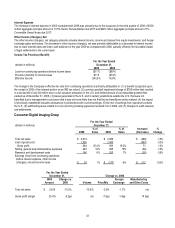
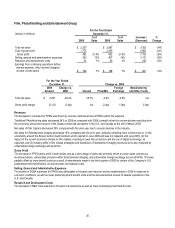
In the first quarter of 2008, the Company performed an updated analysis of expected industry-wide declines in the traditional film and
paper businesses and its useful lives on related assets. Based on additional experience in the secular decline in these product
groups, the Company assessed that overall film demand had declined but at a slower rate than anticipated in 2005, notably in the
motion picture films category, which accounts for a substantial portion of the manufacturing asset utilization in the film business. In
addition, the demand declines in the Company’s paper business have not been as extensive as assumed in 2005. As a result, the
Company revised the useful lives of certain existing production machinery and equipment, and manufacturing-related buildings
effective January 1, 2008. These assets, which were previously set to fully depreciate by mid-2010, are now being depreciated with
estimated useful lives ending from 2011 to 2015. The change in useful lives reflects the Company’s estimate of future periods to be
benefited from the use of the property, plant, and equipment. As a result of these changes, for full year 2008 the Company reduced
depreciation expense by approximately $107 million, of which approximately $95 million benefited loss from continuing operations
before income taxes. The net impact of the change in estimate to loss from continuing operations for the year ended December 31,
2008 was a reduced loss of $93 million, or $.33 on a fully-diluted loss per share basis.
Selling, General and Administrative Expenses
The year-over-year decrease in consolidated selling, general and administrative expenses (“SG&A”) was primarily attributable to
company-wide cost reduction actions, and lower benefit costs (including other postemployment benefits – see below), partially offset
by unfavorable foreign exchange, a contingency accrual related to employment litigation matters of approximately $20 million, and
costs associated with the Company’s participation in the drupa tradeshow in the second quarter of 2008.
Research and Development Costs
The decrease in consolidated research and development costs (“R&D”) compared with prior year was primarily attributable to
company-wide cost reduction actions and significantly reduced spending in 2008 within CDG due to the introduction of consumer
inkjet printers in 2007. These decreases in R&D spending were partially offset by investments in new workflow products in Enterprise
Solutions and stream technology within Digital Printing Solutions, and R&D related acquisitions made in the second quarter of 2008,
both within GCG.
Postemployment Benefit Plan Changes
In the third quarter of 2008, the Company amended certain of its U.S. postemployment benefits effective as of January 1, 2009. As a
result of these plan changes, curtailment and other gains of $94 million were recognized in the third quarter of 2008. The gains are
reflected in the Consolidated Statement of Operations as follows: $48 million in cost of goods sold, $27 million in SG&A, and $19
million in R&D. The impact of these gains is not reflected in segment results. Refer to Note 18, “Other Postretirement Benefits,” and
Note 24, “Segment Information,” in the Notes to Financial Statements.
Restructuring Costs, Rationalization and Other
These costs, as well as the restructuring and rationalization-related costs reported in cost of goods sold, are discussed under the
"Restructuring Costs, Rationalization and Other" section.
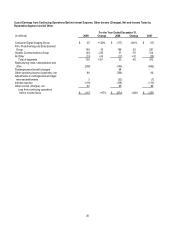
Other Operating Expenses (Income), Net
The Other operating expenses (income), net category includes gains and losses on sales of capital assets and businesses, and
goodwill and other long-lived asset impairment charges. The year-over-year change in Other operating expenses (income), net was
largely driven by the goodwill impairment charge of $785 million in 2008, as compared with significant one-time gains on sales of
capital assets and businesses recognized in 2007. Refer to Note 5, “Goodwill and Other Intangible Assets,” in the Notes to Financial
Statements for more information on the 2008 charge.
Other Income (Charges), Net
The Other income (charges), net category includes interest income, income and losses from equity investments, and foreign
exchange gains and losses. The decrease in Other income (charges), net was primarily attributable to a decrease in interest income
due to lower interest rates and lower cash balances in 2008 as compared with 2007.