Kodak 2009 Annual Report Download - page 35
Download and view the complete annual report
Please find page 35 of the 2009 Kodak annual report below. You can navigate through the pages in the report by either clicking on the pages listed below, or by using the keyword search tool below to find specific information within the annual report.-
 1
1 -
2
-
3
-
4
-
5
-
6
-
7
-
8
-
9
-
10
-
11
-
12
-
13
-
14
-
15
-
16
-
17
-
18
-
19
-
20
-
21
-
22
-
23
-
24
-
 25
25 -
 26
26 -
 27
27 -
 28
28 -
 29
29 -
 30
30 -
 31
31 -
 32
32 -
 33
33 -
 34
34 -
 35
35 -
 36
36 -
 37
37 -
 38
38 -
 39
39 -
 40
40 -
 41
41 -
 42
42 -
 43
43 -
 44
44 -
 45
45 -
46
-
47
-
48
-
49
-
50
-
51
-
52
-
53
-
54
-
55
-
56
-
57
-
58
-
59
-
60
-
61
-
62
-
63
-
64
-
65
-
66
-
67
-
68
-
69
-
70
-
71
-
72
-
73
-
74
-
75
-
76
-
77
-
78
-
79
-
80
-
81
-
82
-
83
-
84
-
85
-
86
-
87
-
88
-
89
-
90
-
91
-
92
-
93
-
94
-
95
-
96
-
97
-
98
-
99
-
100
-
101
-
102
-
103
-
104
-
105
-
106
-
107
-
108
-
109
-
110
-
111
-
112
-
113
-
114
-
115
-
116
-
117
-
118
-
119
-
120
-
121
-
122
-
123
-
124
-
125
-
126
-
127
-
128
-
129
-
130
-
131
-
132
-
133
-
134
-
135
-
136
-
137
-
138
-
139
-
140
-
141
-
142
-
143
-
144
-
145
-
146
-
147
-
148
-
149
-
150
-
151
-
152
-
153
-
154
-
155
-
156
-
157
-
158
-
159
-
160
-
161
-
162
-
163
-
164
-
165
-
166
-
167
-
168
-
169
-
170
-
171
-
172
-
173
-
174
-
175
-
176
-
177
-
178
-
179
-
180
-
181
-
182
-
183
-
184
-
185
-
186
-
187
-
188
-
189
-
190
-
191
-
192
-
193
-
194
-
195
-
196
-
197
-
198
-
199
-
200
-
201
-
202
-
203
-
204
-
205
-
206
-
207
-
208
-
209
-
210
-
211
-
212
-
213
-
214
-
215
-
216
-
217
-
218
-
219
-
220
-
221
-
222
-
223
-
224
-
225
-
226
-
227
-
228
-
229
-
230
-
231
-
232
-
233
-
234
-
235
-
236
-
237
-
238
-
239
-
240
-
241
-
242
-
243
-
244
-
245
-
246
-
247
-
248
-
249
-
250
-
251
-
252
-
253
-
254
-
255
-
256
-
257
-
258
-
259
-
260
-
261
-
262
-
263
-
264
 |
 |

33
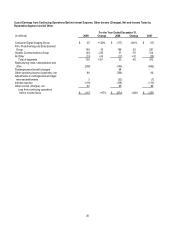
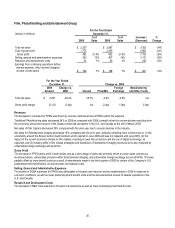
Interest Expense
The increase in interest expense in 2009 compared with 2008 was primarily due to the issuances in the third quarter of 2009 of $300
million aggregate principal amount of 10.5% Senior Secured Notes due 2017 and $400 million aggregate principal amount of 7%
Convertible Senior Notes due 2017.
Other Income (Charges), Net
The other income (charges), net category primarily includes interest income, income and losses from equity investments, and foreign
exchange gains and losses. The decrease in other income (charges), net was primarily attributable to a decrease in interest income
due to lower interest rates and lower cash balances in the year 2009 as compared with 2008, partially offset by the favorable impact
of legal settlements in the current year.
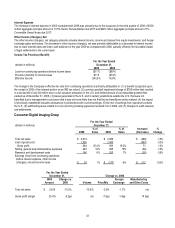
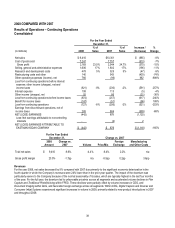
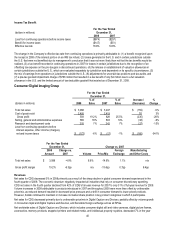
Income Tax Provision (Benefit)
For the Year Ended
(dollars in millions) December 31,
2009 2008
Loss from continuing operations before income taxes ($117) ($874)
Provision (benefit) for income taxes $115 ($147)
Effective tax rate (98.3)% 16.8%
The change in the Company’s effective tax rate from continuing operations is primarily attributable to: (1) a benefit recognized upon
the receipt in 2008 of the interest portion on an IRS tax refund, (2) a pre-tax goodwill impairment charge of $785 million that resulted
in a tax benefit of only $4 million due to a full valuation allowance in the U.S. and limited amount of tax deductible goodwill that
existed as of December 31, 2008, (3) losses generated in the U.S. and in certain jurisdictions outside the U.S. that were not
benefited due to management’s conclusion that it was not more likely than not that the tax benefits would be realized, (4) the impact
of previously established valuation allowances in jurisdictions with current earnings, (5) the mix of earnings from operations outside
the U.S., (6) withholding taxes related to a non-recurring licensing agreement entered into in 2009; and (7) changes in audit reserves
and settlements.
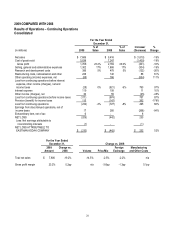
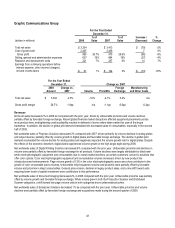
Consumer Digital Imaging Group
For the Year Ended
(dollars in millions) December 31,
2009
% of
Sales 2008
% of
Sales
Increase/
(Decrease)
%
Change
Total net sales $ 2,619 $ 3,088 $ (469) -15%
Cost of goods sold 1,955 2,495 (540) -22%
Gross profit 664 25.4% 593 19.2% 71 12%
Selling, general and administrative expenses 483 18% 565 18% (82) -15%
Research and development costs 146 6% 205 7% (59) -29%
Earnings (loss) from continuing operations
before interest expense, other income
(charges), net and income taxes $ 35 1% $ (177) -6% $ 212 120%
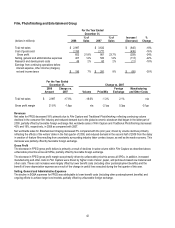
For the Year Ended
December 31, Change vs. 2008
2009
Amount
Change vs.
2008 Volume Price/Mix
Foreign
Exchange
Manufacturing
and Other Costs
Total net sales $ 2,619 -15.2% -10.6% -2.9% -1.7% n/a
Gross profit margin 25.4% 6.2pp n/a -7.3pp -1.4pp 14.9pp