Kodak 2009 Annual Report Download - page 196
Download and view the complete annual report
Please find page 196 of the 2009 Kodak annual report below. You can navigate through the pages in the report by either clicking on the pages listed below, or by using the keyword search tool below to find specific information within the annual report.-
 1
1 -
2
-
3
-
4
-
5
-
6
-
7
-
8
-
9
-
10
-
11
-
12
-
13
-
14
-
15
-
16
-
17
-
18
-
19
-
20
-
21
-
22
-
23
-
24
-
25
-
26
-
27
-
28
-
29
-
30
-
31
-
32
-
33
-
34
-
35
-
36
-
37
-
38
-
39
-
40
-
41
-
42
-
43
-
44
-
45
-
46
-
47
-
48
-
49
-
50
-
51
-
52
-
53
-
54
-
55
-
56
-
57
-
58
-
59
-
60
-
61
-
62
-
63
-
64
-
65
-
66
-
67
-
68
-
69
-
70
-
71
-
72
-
73
-
74
-
75
-
76
-
77
-
78
-
79
-
80
-
81
-
82
-
83
-
84
-
85
-
86
-
87
-
88
-
89
-
90
-
91
-
92
-
93
-
94
-
95
-
96
-
97
-
98
-
99
-
100
-
101
-
102
-
103
-
104
-
105
-
106
-
107
-
108
-
109
-
110
-
111
-
112
-
113
-
114
-
115
-
116
-
117
-
118
-
119
-
120
-
121
-
122
-
123
-
124
-
125
-
126
-
127
-
128
-
129
-
130
-
131
-
132
-
133
-
134
-
135
-
136
-
137
-
138
-
139
-
140
-
141
-
142
-
143
-
144
-
145
-
146
-
147
-
148
-
149
-
150
-
151
-
152
-
153
-
154
-
155
-
156
-
157
-
158
-
159
-
160
-
161
-
162
-
163
-
164
-
165
-
166
-
167
-
168
-
169
-
170
-
171
-
172
-
173
-
174
-
175
-
176
-
177
-
178
-
179
-
180
-
181
-
182
-
183
-
184
-
185
-
 186
186 -
 187
187 -
 188
188 -
 189
189 -
 190
190 -
 191
191 -
 192
192 -
 193
193 -
 194
194 -
 195
195 -
 196
196 -
 197
197 -
 198
198 -
 199
199 -
 200
200 -
 201
201 -
 202
202 -
 203
203 -
 204
204 -
 205
205 -
 206
206 -
207
-
208
-
209
-
210
-
211
-
212
-
213
-
214
-
215
-
216
-
217
-
218
-
219
-
220
-
221
-
222
-
223
-
224
-
225
-
226
-
227
-
228
-
229
-
230
-
231
-
232
-
233
-
234
-
235
-
236
-
237
-
238
-
239
-
240
-
241
-
242
-
243
-
244
-
245
-
246
-
247
-
248
-
249
-
250
-
251
-
252
-
253
-
254
-
255
-
256
-
257
-
258
-
259
-
260
-
261
-
262
-
263
-
264
 |
 |

52
2010 Equity Grant: Delivered in September 2009
In September of 2009, the Committee determined that it would accelerate the Company’s 2010 equity grant into 2009 to increase the value
of unvested equity held by executives in order to establish a meaningful retentive incentive and better align the economic interests of
management with shareholder interests. The decision applied to the 2010 equity grant only and does not carry forward to future years. The
Committee intends to return to a more typical equity approach in 2011, assuming business conditions warrant doing so.
The accelerated grant was delivered in the form of time-based RSUs with extended vesting requirements.
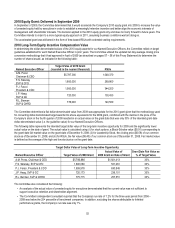
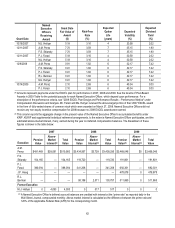
2010 Long-Term Equity Incentive Compensation Value
In determining the dollar-denominated values of the 2010 equity awards for our Named Executive Officers, the Committee relied on target
guidelines established for each Named Executive Officer in prior years. The Committee utilized the updated ten day average closing price
conversion methodology that it had approved in April of 2009 (as described on pages 57 – 58 of this Proxy Statement) to determine the
number of shares issued, as indicated in the following table:
Named Executive Officer
Target Value of 2010 Grant
(rounded to the nearest thousand)
RSUs
A.M. Perez
Chairman & CEO
$5,787,000
1,048,370
F.S. Sklarsky
EVP & CFO
1,600,000
289,860
P.J. Faraci
President & COO
1,900,000
344,200
J.P. Haag
SVP & GC
720,000
130,430
R.L. Berman
SVP & CHRO
776,000
140,580
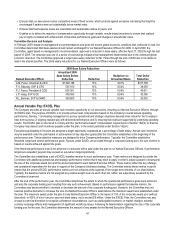
The Committee determined a flat dollar-denominated value from 2009 was appropriate for the 2010 grant given that the methodology used
for converting dollar-denominated target awards into share equivalents for the 2009 grant, combined with the decline in the price of the
Company’s stock in the fourth quarter of 2008 resulted in an actual value on the grant date that was only 33% of the intended grant date
dollar-denominated value (i.e. the guideline value) for our Named Executive Officers.
The following table represents the intended target dollar value of the long-term incentive opportunity for 2009 and the significantly lower
actual value on the date of grant. The actual value is calculated using: (i) for stock options, a Black-Scholes value ($0.91) corresponding to
the grant date fair market value on the grant date of December 9, 2008; (ii) for Leadership Stock, the closing price ($6.58) of our common
stock as of December 31, 2008; and (iii) for RSUs, the fair value ($6.43) of our common stock as of December 31, 2008. Fair market value
is defined as the average of the high and low stock price on the grant date.
Target Dollar Value of Long-Term Incentive Opportunity
Named Executive Officer
Target Value of 2009 Grant
Actual Value of
2009 Grant on Date of Grant
Grant Date Fair Value as
% of Target Value
A.M. Perez, Chairman & CEO
$5,786,886
$ 1,921,413
33%
F.S. Sklarsky, EVP & CFO
1,600,080
531,261
33%
P.J. Faraci, President & COO
1,899,978
630,845
33%
J.P. Haag, SVP & GC
720,173
239,151
33%
R.L. Berman, SVP & CHRO
775,715
257,551
33%
The Committee also considered the following:
• An analysis of the actual value of unvested equity for executives demonstrated that the current value was not sufficient to
support executive retention and shareholder alignment.
• The Committee’s independent consultant reported that the Company’s run rate of 1.2% for the three-year period from 2006 –
2008 was below the 25th percentile of benchmark companies. In addition, excluding the shares attributable to forfeited
performance grants, the Company’s run rate was only 1%.