Kodak 2009 Annual Report Download - page 42
Download and view the complete annual report
Please find page 42 of the 2009 Kodak annual report below. You can navigate through the pages in the report by either clicking on the pages listed below, or by using the keyword search tool below to find specific information within the annual report.-
 1
1 -
2
-
3
-
4
-
5
-
6
-
7
-
8
-
9
-
10
-
11
-
12
-
13
-
14
-
15
-
16
-
17
-
18
-
19
-
20
-
21
-
22
-
23
-
24
-
25
-
26
-
27
-
28
-
29
-
30
-
31
-
 32
32 -
 33
33 -
 34
34 -
 35
35 -
 36
36 -
 37
37 -
 38
38 -
 39
39 -
 40
40 -
 41
41 -
 42
42 -
 43
43 -
 44
44 -
 45
45 -
 46
46 -
 47
47 -
 48
48 -
 49
49 -
 50
50 -
 51
51 -
 52
52 -
53
-
54
-
55
-
56
-
57
-
58
-
59
-
60
-
61
-
62
-
63
-
64
-
65
-
66
-
67
-
68
-
69
-
70
-
71
-
72
-
73
-
74
-
75
-
76
-
77
-
78
-
79
-
80
-
81
-
82
-
83
-
84
-
85
-
86
-
87
-
88
-
89
-
90
-
91
-
92
-
93
-
94
-
95
-
96
-
97
-
98
-
99
-
100
-
101
-
102
-
103
-
104
-
105
-
106
-
107
-
108
-
109
-
110
-
111
-
112
-
113
-
114
-
115
-
116
-
117
-
118
-
119
-
120
-
121
-
122
-
123
-
124
-
125
-
126
-
127
-
128
-
129
-
130
-
131
-
132
-
133
-
134
-
135
-
136
-
137
-
138
-
139
-
140
-
141
-
142
-
143
-
144
-
145
-
146
-
147
-
148
-
149
-
150
-
151
-
152
-
153
-
154
-
155
-
156
-
157
-
158
-
159
-
160
-
161
-
162
-
163
-
164
-
165
-
166
-
167
-
168
-
169
-
170
-
171
-
172
-
173
-
174
-
175
-
176
-
177
-
178
-
179
-
180
-
181
-
182
-
183
-
184
-
185
-
186
-
187
-
188
-
189
-
190
-
191
-
192
-
193
-
194
-
195
-
196
-
197
-
198
-
199
-
200
-
201
-
202
-
203
-
204
-
205
-
206
-
207
-
208
-
209
-
210
-
211
-
212
-
213
-
214
-
215
-
216
-
217
-
218
-
219
-
220
-
221
-
222
-
223
-
224
-
225
-
226
-
227
-
228
-
229
-
230
-
231
-
232
-
233
-
234
-
235
-
236
-
237
-
238
-
239
-
240
-
241
-
242
-
243
-
244
-
245
-
246
-
247
-
248
-
249
-
250
-
251
-
252
-
253
-
254
-
255
-
256
-
257
-
258
-
259
-
260
-
261
-
262
-
263
-
264
 |
 |

40
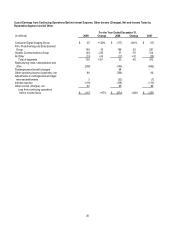
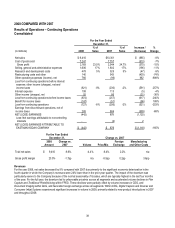
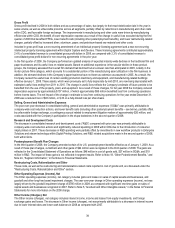
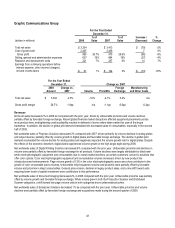
Income Tax Benefit
For the Year Ended
(dollars in millions) December 31,
2008 2007
Loss from continuing operations before income taxes ($874) ($257)
Benefit for income taxes ($147) ($51)
Effective tax rate 16.8% 19.8%
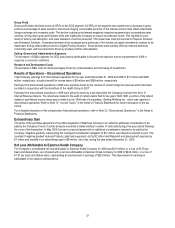
The change in the Company’s effective tax rate from continuing operations is primarily attributable to: (1) a benefit recognized upon
the receipt in 2008 of the interest portion on an IRS tax refund, (2) losses generated in the U.S. and in certain jurisdictions outside
the U.S. that were not benefited due to management’s conclusion that it was not more likely than not that the tax benefits would be
realized, (3) a tax benefit recorded in continuing operations in 2007 for losses in certain jurisdictions due to the recognition of an
offsetting tax expense on the pre-tax gain in discontinued operations, (4) the release or establishment of valuation allowances in
certain jurisdictions outside the U.S., which are evaluated separately by jurisdiction and dependent on its specific circumstances, (5)
the mix of earnings from operations in jurisdictions outside the U.S., (6) adjustments for uncertain tax positions and tax audits, and
(7) a pre-tax goodwill impairment charge of $785 million that resulted in a tax benefit of only $4 million due to a full valuation
allowance in the U.S. and the limited amount of tax deductible goodwill that existed as of December 31, 2008.
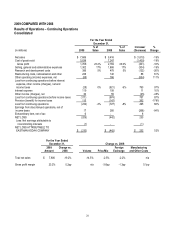
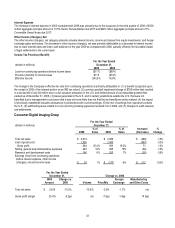
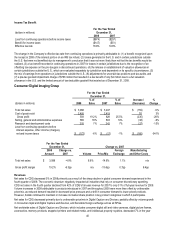
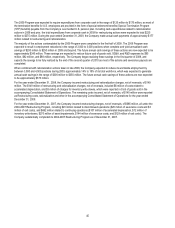
Consumer Digital Imaging Group
For the Year Ended
December 31,
(dollars in millions) 2008
% of
Sales 2007
% of
Sales
Increase /
(Decrease)
%
Change
Total net sales $ 3,088 $ 3,247 $ (159) -5%
Cost of goods sold 2,495 2,419 76 3%
Gross profit 593 19.2% 828 25.5% (235) -28%
Selling, general and administrative expenses 565 18% 603 19% (38) -6%
Research and development costs 205 7% 242 7% (37) -15%
Loss from continuing operations before
interest expense, other income (charges),
net and income taxes $ (177) -6% $ (17) -1% $ (160) -941%
For the Year Ended
December 31, Change vs. 2007
2008
Amount
Change vs.
2007 Volume Price/Mix
Foreign
Exchange
Manufacturing
and Other Costs
Total net sales $ 3,088 -4.9% 8.6% -14.6% 1.1% n/a
Gross profit margin 19.2% -6.3pp n/a -13.4pp 0.7pp 6.4pp
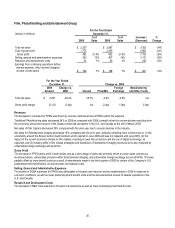
Revenues
Net sales for CDG decreased 5% in 2008 primarily as a result of the sharp decline in global consumer demand experienced in the
fourth quarter of 2008. The economic downturn negatively impacted all industries that rely on consumer discretionary spending.
CDG net sales in the fourth quarter declined from 42% of CDG’s full-year revenue for 2007 to only 31% of full-year revenue for 2008.
Volume increases in 2008 attributable to products introduced in 2007 and throughout 2008 were more than offset by unfavorable
price/mix, as reduced demand resulted in downward price pressure and a shift in consumer demand to lower-priced products.
However, Kodak continued to maintain or increase its market share position in key product categories in which it participates.
Net sales for CDG decreased primarily due to unfavorable price/mix in Digital Capture and Devices, partially offset by volume growth
in Consumer Inkjet and Digital Capture and Devices, and favorable foreign exchange across all SPGs.
Net worldwide sales of Digital Capture and Devices, which includes consumer digital still and video cameras, digital picture frames,
accessories, memory products, snapshot printers and related media, and intellectual property royalties, decreased 7% in the year