Holiday Inn 2012 Annual Report Download - page 98
Download and view the complete annual report
Please find page 98 of the 2012 Holiday Inn annual report below. You can navigate through the pages in the report by either clicking on the pages listed below, or by using the keyword search tool below to find specific information within the annual report.-
 1
1 -
2
-
3
-
4
-
5
-
6
-
7
-
8
-
9
-
10
-
11
-
12
-
13
-
14
-
15
-
16
-
17
-
18
-
19
-
20
-
21
-
22
-
23
-
24
-
25
-
26
-
27
-
28
-
29
-
30
-
31
-
32
-
33
-
34
-
35
-
36
-
37
-
38
-
39
-
40
-
41
-
42
-
43
-
44
-
45
-
46
-
47
-
48
-
49
-
50
-
51
-
52
-
53
-
54
-
55
-
56
-
57
-
58
-
59
-
60
-
61
-
62
-
63
-
64
-
65
-
66
-
67
-
68
-
69
-
70
-
71
-
72
-
73
-
74
-
75
-
76
-
77
-
78
-
79
-
80
-
81
-
82
-
83
-
84
-
85
-
86
-
87
-
 88
88 -
 89
89 -
 90
90 -
 91
91 -
 92
92 -
 93
93 -
 94
94 -
 95
95 -
 96
96 -
 97
97 -
 98
98 -
 99
99 -
 100
100 -
 101
101 -
 102
102 -
 103
103 -
 104
104 -
 105
105 -
 106
106 -
 107
107 -
 108
108 -
109
-
110
-
111
-
112
-
113
-
114
-
115
-
116
-
117
-
118
-
119
-
120
-
121
-
122
-
123
-
124
-
125
-
126
-
127
-
128
-
129
-
130
-
131
-
132
-
133
-
134
-
135
-
136
-
137
-
138
-
139
-
140
-
141
-
142
-
143
-
144
 |
 |
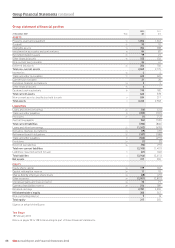
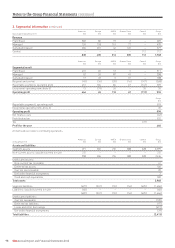
96 IHG Annual Report and Financial Statements 2012
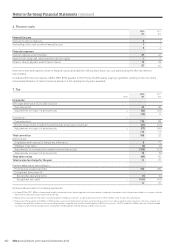
Americas Europe AMEA Greater China Central Group
Year ended 31 December 2012 $m $m $m $m $m $m
Revenue
Franchised 541 91 18 3 – 653
Managed 97 147 152 89 – 485
Owned and leased 199 198 48 138 – 583
Central – – – – 114 114
837 436 218 230 114 1,835
Americas Europe AMEA Greater China Central Group
$m $m $m $m $m $m
Segmental result
Franchised 466 65 12 4 – 547
Managed 48 32 90 51 – 221
Owned and leased 24 50 6 45 – 125
Regional and central (52) (32) (20) (19) (156) (279)
Reportable segments’ operating profit 486 115 88 81 (156) 614
Exceptional operating items (note 5) 23 (4) (5) – (18) (4)
Operating profit 509 111 83 81 (174) 610
Group
$m
Reportable segments’ operating profit 614
Exceptional operating items (note 5) (4)
Operating profit 610
Net finance costs (54)
Profit before tax 556
Tax (11)
Profit for the year 545
All items above relate to continuing operations.
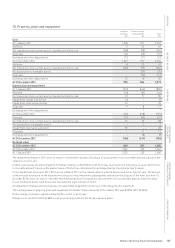
1. Exchange rates
The results of operations have been translated into US dollars
at the average rates of exchange for the year. In the case of sterling,
the translation rate is $1=£0.63 (2011 $1=£0.62). In the case of the
euro, the translation rate is $1=€0.78 (2011 $1=€0.72).
Assets and liabilities have been translated into US dollars at the
rates of exchange on the last day of the year. In the case of sterling,
the translation rate is $1=£0.62 (2011 $1=£0.65). In the case of the
euro, the translation rate is $1=€0.76 (2011 $1=€0.77).
2. Segmental information
The management of the Group’s operations, excluding Central
functions, is organised within four geographical regions:
• Americas;
• Europe;
• Asia, Middle East and Africa (AMEA); and
• Greater China.
These, together with Central functions, comprise the Group’s
five reportable segments. No operating segments have been
aggregated to form these reportable segments.
Central functions include costs of global functions including
technology, sales and marketing, finance, human resources and
corporate services; revenue arises principally from technology fee
income. Central liabilities include the loyalty programme liability
and the cumulative short-term System Fund surplus.
Each of the geographical regions derives its revenues from either
franchising, managing or owning hotels and additional segmental
disclosures are provided accordingly.
Management monitors the operating results of the geographical
regions and Central functions separately for the purpose of making
decisions about resource allocation and performance assessment.
Segmental performance is evaluated based on operating profit or
loss and is measured consistently with operating profit or loss in
the Consolidated Financial Statements, excluding exceptional
items. Group financing activities and income taxes are managed
on a group basis and are not allocated to reportable segments.
Notes to the Group Financial Statements