Holiday Inn 2012 Annual Report Download - page 70
Download and view the complete annual report
Please find page 70 of the 2012 Holiday Inn annual report below. You can navigate through the pages in the report by either clicking on the pages listed below, or by using the keyword search tool below to find specific information within the annual report.-
 1
1 -
2
-
3
-
4
-
5
-
6
-
7
-
8
-
9
-
10
-
11
-
12
-
13
-
14
-
15
-
16
-
17
-
18
-
19
-
20
-
21
-
22
-
23
-
24
-
25
-
26
-
27
-
28
-
29
-
30
-
31
-
32
-
33
-
34
-
35
-
36
-
37
-
38
-
39
-
40
-
41
-
42
-
43
-
44
-
45
-
46
-
47
-
48
-
49
-
50
-
51
-
52
-
53
-
54
-
55
-
56
-
57
-
58
-
59
-
 60
60 -
 61
61 -
 62
62 -
 63
63 -
 64
64 -
 65
65 -
 66
66 -
 67
67 -
 68
68 -
 69
69 -
 70
70 -
 71
71 -
 72
72 -
 73
73 -
 74
74 -
 75
75 -
 76
76 -
 77
77 -
 78
78 -
 79
79 -
 80
80 -
81
-
82
-
83
-
84
-
85
-
86
-
87
-
88
-
89
-
90
-
91
-
92
-
93
-
94
-
95
-
96
-
97
-
98
-
99
-
100
-
101
-
102
-
103
-
104
-
105
-
106
-
107
-
108
-
109
-
110
-
111
-
112
-
113
-
114
-
115
-
116
-
117
-
118
-
119
-
120
-
121
-
122
-
123
-
124
-
125
-
126
-
127
-
128
-
129
-
130
-
131
-
132
-
133
-
134
-
135
-
136
-
137
-
138
-
139
-
140
-
141
-
142
-
143
-
144
 |
 |

68 IHG Annual Report and Financial Statements 2012
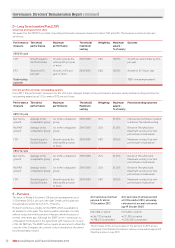
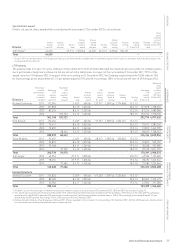
G – Long Term Incentive Plan (LTIP)
The LTIP allows Executive Directors and other eligible executives to receive share awards, subject to the achievement of performance targets
set by the Committee, measured over a three-year period. Awards are made annually and, other than in exceptional circumstances, will not
exceed three times annual salary for Executive Directors.
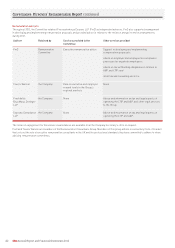
Why do we use these measures?
Net rooms growth RevPAR growth TSR
This measures the net growth in total
number of IHG hotel rooms over the duration
of the cycle relative to our major global
competitors. Together with the RevPAR
measure, it provides focus on ensuring a
balance between the quality of IHG hotels
and the speed at which IHG grows.
This measures success in growing our rates
for the rooms we have open for the duration
of the cycle relative to the RevPAR growth of
our major global competitors.
This measures the return to shareholders
by investing in IHG relative to our
competitors in the DJGH index.
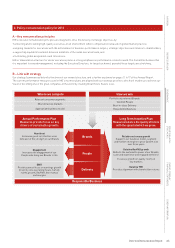
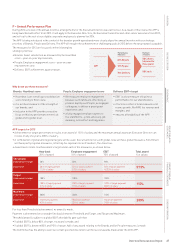
In order to generate higher returns for our shareholders, we need to increase revenue share, improve operating efficiency and grow margins
through increasing the number of rooms we have available to sell, as well as generating more RevPAR for those rooms. By focussing on both
net rooms growth and RevPAR growth, we are rewarding the balanced approach to growth that will support the long-term increase in
shareholder value.
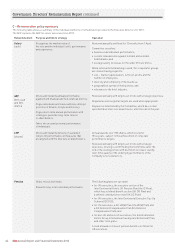
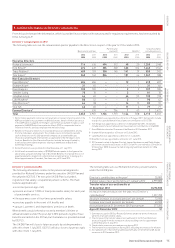
Performance measure Weighting Threshold
requirement
Threshold
performance
Maximum
requirement
Maximum
performance
Net rooms growth v
major competitors
25% Equal to average growth
of comparator group
20% Ranked as 1st in the
comparator group
100%
RevPAR growth v
major competitors
25% Equal to average growth
of comparator group
20% Ranked as 1st in the
comparator group
100%
TSR growth v
DJGH index
50% Equal to index 20% Outperform index by 8% or
more per year (equivalent to
26% over three years)
100%
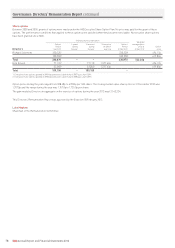
For the 2013/15 LTIP cycle, the Committee resolved to grant maximum awards at 205% of base salary for the Executive Directors. Vesting
for points between Threshold and Maximum will be calculated on a straight-line basis.
In setting the TSR performance target, the Committee has taken into account a range of factors, including IHG’s strategic plans, historical
performance of the industry and FTSE 100 market practice.
After testing the performance targets set at grant, the Committee will review the vesting outcomes of the net rooms and RevPAR measures
against an assessment of earnings and quality of Company financial performance over the period. The Committee may reduce the number
of shares which vest if they determine such an adjustment is appropriate. IHG’s performance and vesting outcomes will be fully disclosed
and explained in the relevant Directors’ Remuneration Report.
There is no re-testing of performance targets under the LTIP, and awards lapse if they are not met.
The performance measures for the 2013/15 cycle are:
• cumulative annual growth in net rooms;
• cumulative annual like-for-like RevPAR growth; and
• IHG’s TSR relative to the DJGH index.
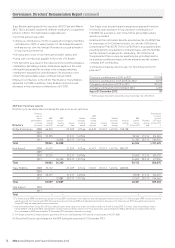
Growth in net rooms and RevPAR are measured on a relative basis
against the comparator group, comprising the following major
globally branded competitors: Accor, Choice, Hilton, Hyatt, Marriott,
Starwood and Wyndham.
These performance measures are also used in the 2011/13 and
2012/14 LTIP cycles, granted in 2011 and 2012 respectively.
For the 2010/12 LTIP cycle, the performance measures were TSR
and EPS; details of structure and outcome are set out on page 72.
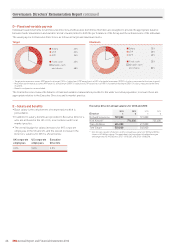
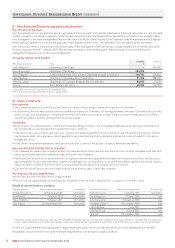
LTIP 25% RevPAR
50% TSR
25% net rooms
100%
shares
Performance
measures Payment
structure
Governance: Directors’ Remuneration Report continued