Holiday Inn 2012 Annual Report Download - page 67
Download and view the complete annual report
Please find page 67 of the 2012 Holiday Inn annual report below. You can navigate through the pages in the report by either clicking on the pages listed below, or by using the keyword search tool below to find specific information within the annual report.-
 1
1 -
2
-
3
-
4
-
5
-
6
-
7
-
8
-
9
-
10
-
11
-
12
-
13
-
14
-
15
-
16
-
17
-
18
-
19
-
20
-
21
-
22
-
23
-
24
-
25
-
26
-
27
-
28
-
29
-
30
-
31
-
32
-
33
-
34
-
35
-
36
-
37
-
38
-
39
-
40
-
41
-
42
-
43
-
44
-
45
-
46
-
47
-
48
-
49
-
50
-
51
-
52
-
53
-
54
-
55
-
56
-
 57
57 -
 58
58 -
 59
59 -
 60
60 -
 61
61 -
 62
62 -
 63
63 -
 64
64 -
 65
65 -
 66
66 -
 67
67 -
 68
68 -
 69
69 -
 70
70 -
 71
71 -
 72
72 -
 73
73 -
 74
74 -
 75
75 -
 76
76 -
 77
77 -
78
-
79
-
80
-
81
-
82
-
83
-
84
-
85
-
86
-
87
-
88
-
89
-
90
-
91
-
92
-
93
-
94
-
95
-
96
-
97
-
98
-
99
-
100
-
101
-
102
-
103
-
104
-
105
-
106
-
107
-
108
-
109
-
110
-
111
-
112
-
113
-
114
-
115
-
116
-
117
-
118
-
119
-
120
-
121
-
122
-
123
-
124
-
125
-
126
-
127
-
128
-
129
-
130
-
131
-
132
-
133
-
134
-
135
-
136
-
137
-
138
-
139
-
140
-
141
-
142
-
143
-
144
 |
 |

OVERVIEW BUSINESS REVIEW GOVERNANCE
GROUP FINANCIAL
STATEMENTS
PARENT COMPANY
FINANCIAL STATEMENTS OTHER INFORMATION
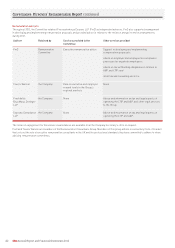
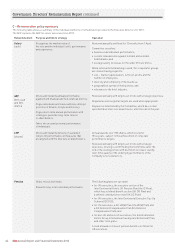
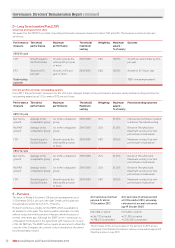
Opportunity Performance metrics Changes in year
Determined annually on the
factors set out to the left
None Directors’ salaries
increased between
2.5%-3% in 2012
Target = 115% of salary
Maximum = 200% of salary
20% Brands: year-on-year improvement in guest
satisfaction
10% People: year-on-year improvement in employee
engagement
70% Delivery: EBIT v target
All targets measured over one year
APP for senior
executives from 2013
Maximum for 2013/15 LTIP cycle =
205% of salary
Will not exceed three times annual
salary other than in exceptional
circumstances
25% relative net rooms growth and 25% relative RevPAR
growth (both measured v comparator group):
• 20% threshold vesting if equal to average growth of
comparator group;
• maximum vesting if ranked as 1st in the comparator
group; and
• straight-line vesting in between.
50% relative TSR (v DJGH index):
• 20% threshold vesting if equal to index;
• maximum vesting if 8% or more per year ahead of index; and
• straight-line vesting in between.
All targets measured over a three-year performance period
None in 2012
UK DB Plan: 1/30th accrual rate
UK DC Plan: 7.5% employee
contribution with 30% matching
Company contribution
US 401(k) Plan: 2%-75% employee
contribution with 4% matching
Company contribution
US Deferred Compensation Plan:
up to 75% employee contribution
with 2% matching Company
contribution and 4%-20% additional
Company contribution if certain
conditions are met
None None in 2012
UK DB Plan will close
to future accrual for
existing members with
effect from 1 July 2013
Directors’ Remuneration Report 65