Holiday Inn 2012 Annual Report Download - page 115
Download and view the complete annual report
Please find page 115 of the 2012 Holiday Inn annual report below. You can navigate through the pages in the report by either clicking on the pages listed below, or by using the keyword search tool below to find specific information within the annual report.-
 1
1 -
2
-
3
-
4
-
5
-
6
-
7
-
8
-
9
-
10
-
11
-
12
-
13
-
14
-
15
-
16
-
17
-
18
-
19
-
20
-
21
-
22
-
23
-
24
-
25
-
26
-
27
-
28
-
29
-
30
-
31
-
32
-
33
-
34
-
35
-
36
-
37
-
38
-
39
-
40
-
41
-
42
-
43
-
44
-
45
-
46
-
47
-
48
-
49
-
50
-
51
-
52
-
53
-
54
-
55
-
56
-
57
-
58
-
59
-
60
-
61
-
62
-
63
-
64
-
65
-
66
-
67
-
68
-
69
-
70
-
71
-
72
-
73
-
74
-
75
-
76
-
77
-
78
-
79
-
80
-
81
-
82
-
83
-
84
-
85
-
86
-
87
-
88
-
89
-
90
-
91
-
92
-
93
-
94
-
95
-
96
-
97
-
98
-
99
-
100
-
101
-
102
-
103
-
104
-
 105
105 -
 106
106 -
 107
107 -
 108
108 -
 109
109 -
 110
110 -
 111
111 -
 112
112 -
 113
113 -
 114
114 -
 115
115 -
 116
116 -
 117
117 -
 118
118 -
 119
119 -
 120
120 -
 121
121 -
 122
122 -
 123
123 -
 124
124 -
 125
125 -
126
-
127
-
128
-
129
-
130
-
131
-
132
-
133
-
134
-
135
-
136
-
137
-
138
-
139
-
140
-
141
-
142
-
143
-
144
 |
 |

OVERVIEW BUSINESS REVIEW GOVERNANCE
GROUP FINANCIAL
STATEMENTS
PARENT COMPANY
FINANCIAL STATEMENTS OTHER INFORMATION
Notes to the Group Financial Statements 113
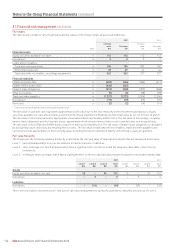
21. Financial risk management continued
Liquidity risk
The following are the undiscounted contractual cash flows of financial liabilities, including interest payments:
Less than Between 1 and Between 2 and More than
1 year 2 years 5 years 5 years Total
$m $m $m $m $m
31 December 2012
Non-derivative financial liabilities:
Secured bank loans – – 5 – 5
£250m 6% bonds 2016 24 24 453 – 501
£400m 3.875% bonds 2022 25 25 75 772 897
Finance lease obligations 16 16 48 3,316 3,396
Trade and other payables 709 154 191 285 1,339
Provisions 1 1 – – 2
Derivative financial liabilities:
Forward foreign exchange contracts (2) – – – (2)
Currency swaps – outflows 26 26 467 – 519
– inflows (24) (24) (453) – (501)
Less than Between 1 and Between 2 and More than
1 year 2 years 5 years 5 years Total
$m $m $m $m $m
31 December 2011
Non-derivative financial liabilities:
Secured bank loans 5 – – – 5
£250m 6% bonds 2016 23 23 456 – 502
Finance lease obligations 16 16 48 3,332 3,412
Unsecured bank loans 100 – – – 100
Trade and other payables 707 123 135 324 1,289
Provisions 12 1 1 – 14
Derivative financial liabilities:
Interest rate swaps 1 – – – 1
Forward foreign exchange contracts (3) – – – (3)
Currency swaps – outflows 26 26 492 – 544
– inflows (23) (23) (456) – (502)
Cash flows relating to unsecured bank loans are classified according to the maturity date of the loan drawdown rather than the facility
maturity date.
Interest rate swaps are expected to affect profit or loss in the same periods that the cash flows are expected to occur.
Credit risk
The carrying amount of financial assets represents the maximum exposure to credit risk.
2012 2011
$m $m
Equity securities available-for-sale 112 112
Derivative financial instruments 2 3
Loans and receivables:
Cash and cash equivalents 195 182
Other financial assets 49 44
Trade and other receivables, excluding prepayments 362 327
720 668