Holiday Inn 2012 Annual Report Download - page 86
Download and view the complete annual report
Please find page 86 of the 2012 Holiday Inn annual report below. You can navigate through the pages in the report by either clicking on the pages listed below, or by using the keyword search tool below to find specific information within the annual report.-
 1
1 -
2
-
3
-
4
-
5
-
6
-
7
-
8
-
9
-
10
-
11
-
12
-
13
-
14
-
15
-
16
-
17
-
18
-
19
-
20
-
21
-
22
-
23
-
24
-
25
-
26
-
27
-
28
-
29
-
30
-
31
-
32
-
33
-
34
-
35
-
36
-
37
-
38
-
39
-
40
-
41
-
42
-
43
-
44
-
45
-
46
-
47
-
48
-
49
-
50
-
51
-
52
-
53
-
54
-
55
-
56
-
57
-
58
-
59
-
60
-
61
-
62
-
63
-
64
-
65
-
66
-
67
-
68
-
69
-
70
-
71
-
72
-
73
-
74
-
75
-
 76
76 -
 77
77 -
 78
78 -
 79
79 -
 80
80 -
 81
81 -
 82
82 -
 83
83 -
 84
84 -
 85
85 -
 86
86 -
 87
87 -
 88
88 -
 89
89 -
 90
90 -
 91
91 -
 92
92 -
 93
93 -
 94
94 -
 95
95 -
 96
96 -
97
-
98
-
99
-
100
-
101
-
102
-
103
-
104
-
105
-
106
-
107
-
108
-
109
-
110
-
111
-
112
-
113
-
114
-
115
-
116
-
117
-
118
-
119
-
120
-
121
-
122
-
123
-
124
-
125
-
126
-
127
-
128
-
129
-
130
-
131
-
132
-
133
-
134
-
135
-
136
-
137
-
138
-
139
-
140
-
141
-
142
-
143
-
144
 |
 |
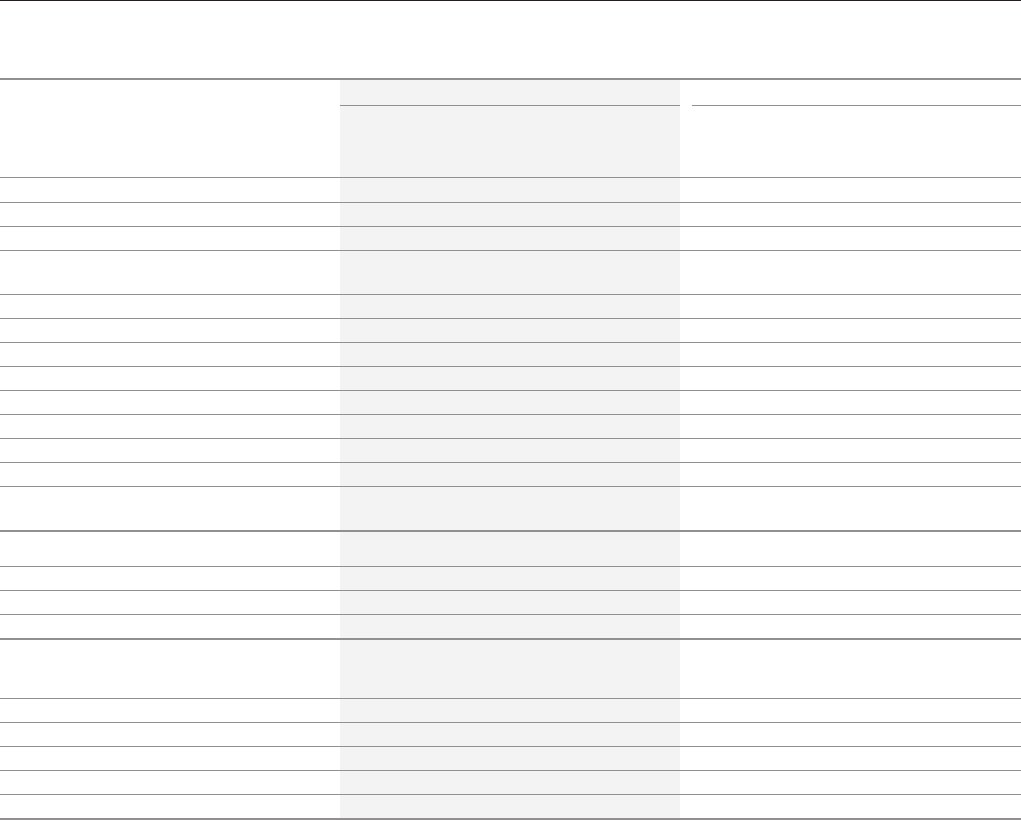
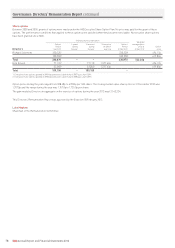
84 IHG Annual Report and Financial Statements 2012
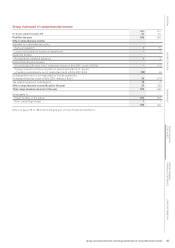
Group income statement
2012 2011
Before Exceptional Before Exceptional
exceptional items exceptional items
items (note 5) Total items (note 5) Total
For the year ended 31 December 2012 Note $m $m $m $m $m $m
Revenue 2 1,835 – 1,835 1,768 – 1,768
Cost of sales (772) – (772) (771) – (771)
Administrative expenses (363) (16) (379) (350) (31) (381)
Other operating income
and expenses 8 (11) (3) 11 46 57
708 (27) 681 658 15 673
Depreciation and amortisation 2 (94) – (94) (99) – (99)
Impairment 2 – 23 23 – 20 20
Operating profit 2 614 (4) 610 559 35 594
Financial income 6 3 – 3 2 – 2
Financial expenses 6 (57) – (57) (64) – (64)
Profit before tax 560 (4) 556 497 35 532
Tax 7 (153) 142 (11) (120) 48 (72)
Profit for the year from
continuing operations 407 138 545 377 83 460
Attributable to:
Equity holders of the parent 406 138 544 377 83 460
Non-controlling interest 1 – 1 – – –
407 138 545 377 83 460
Earnings per ordinary share 9
Continuing and total operations:
Basic 189.5¢ 159.2¢
Diluted 186.3¢ 155.4¢
Adjusted 141.5¢ 130.4¢
Adjusted diluted 139.0¢ 127.4¢
Notes on pages 90 to 128 form an integral part of these Financial Statements.
Group Financial Statements